Source: https://en.wikipedia.org/wiki/Cynefin_frameworkGeopolitic
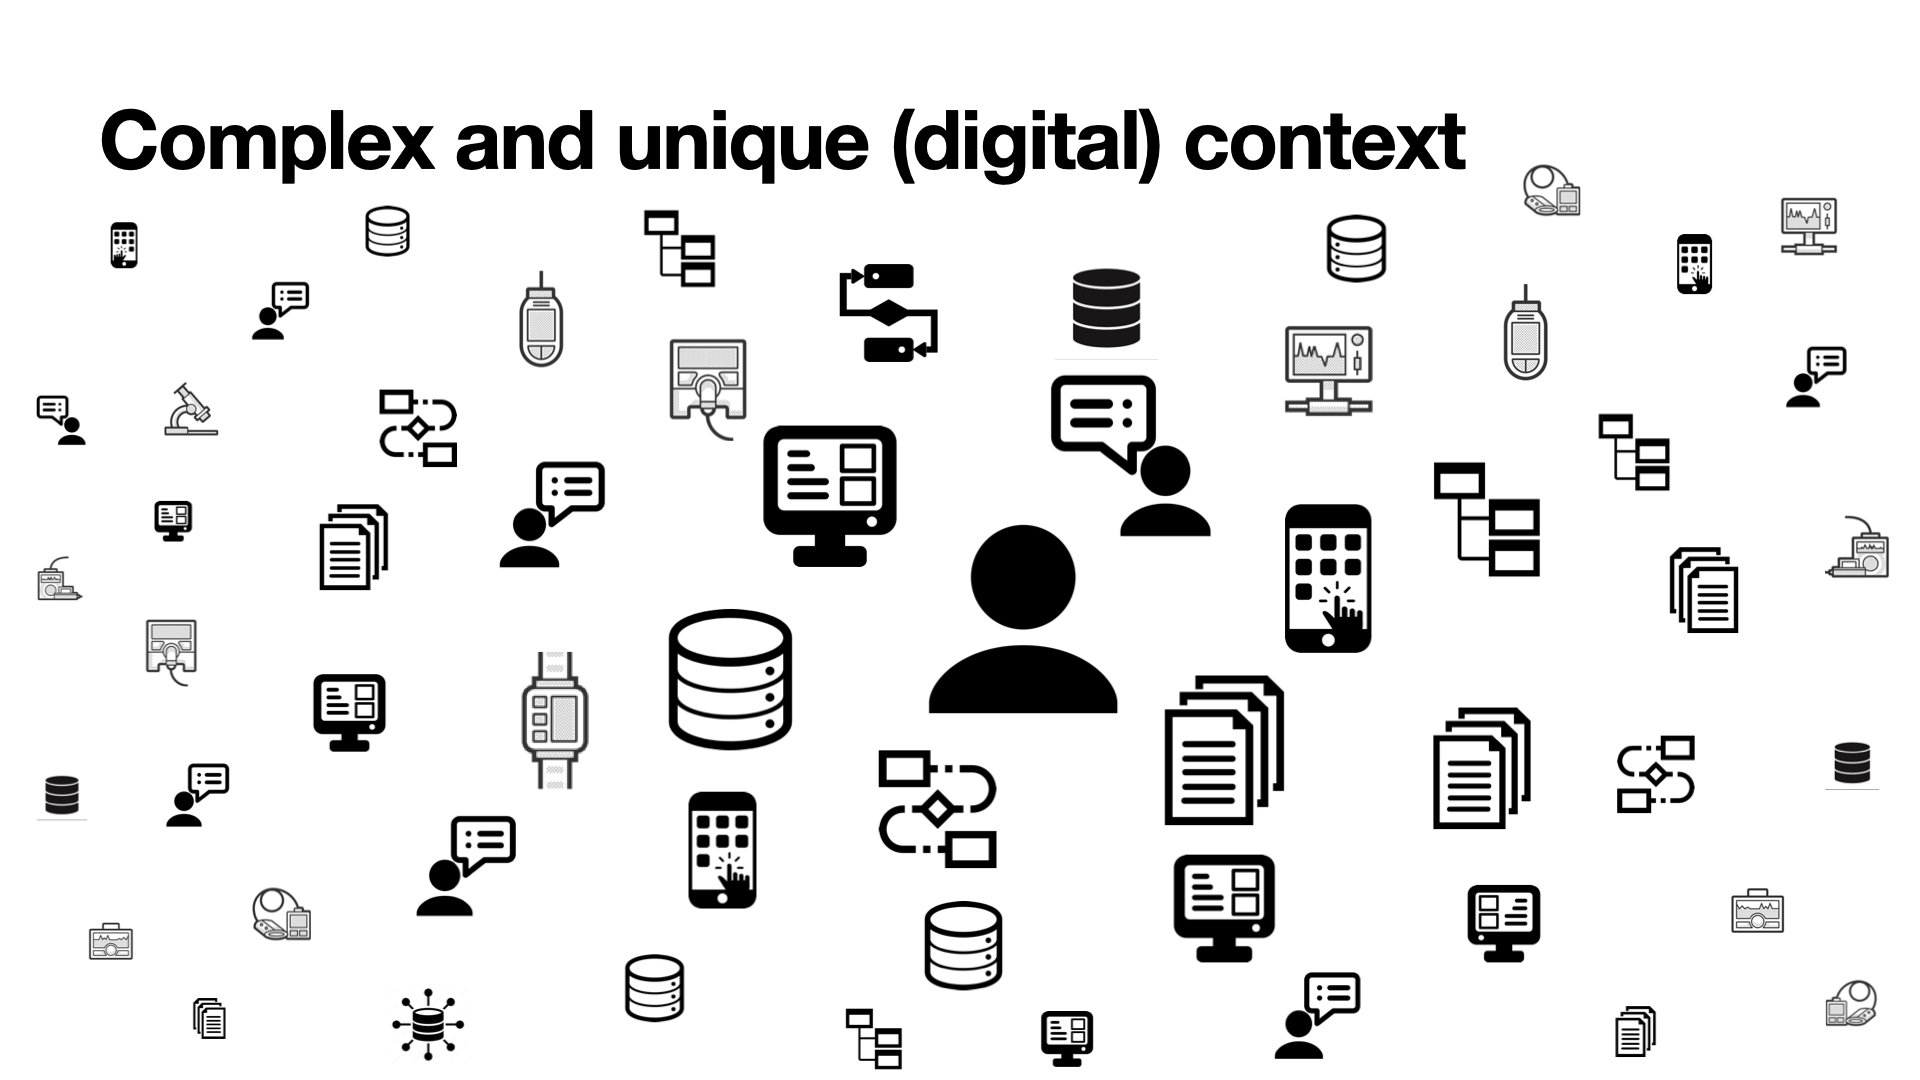
Each customer has unique needs defined by unique context they evolve in.
Context includes
- Personal features: culture, education, life experience, cognitive abilities...
- Non-personal features: constraints, laws, personal goals, definition of success...
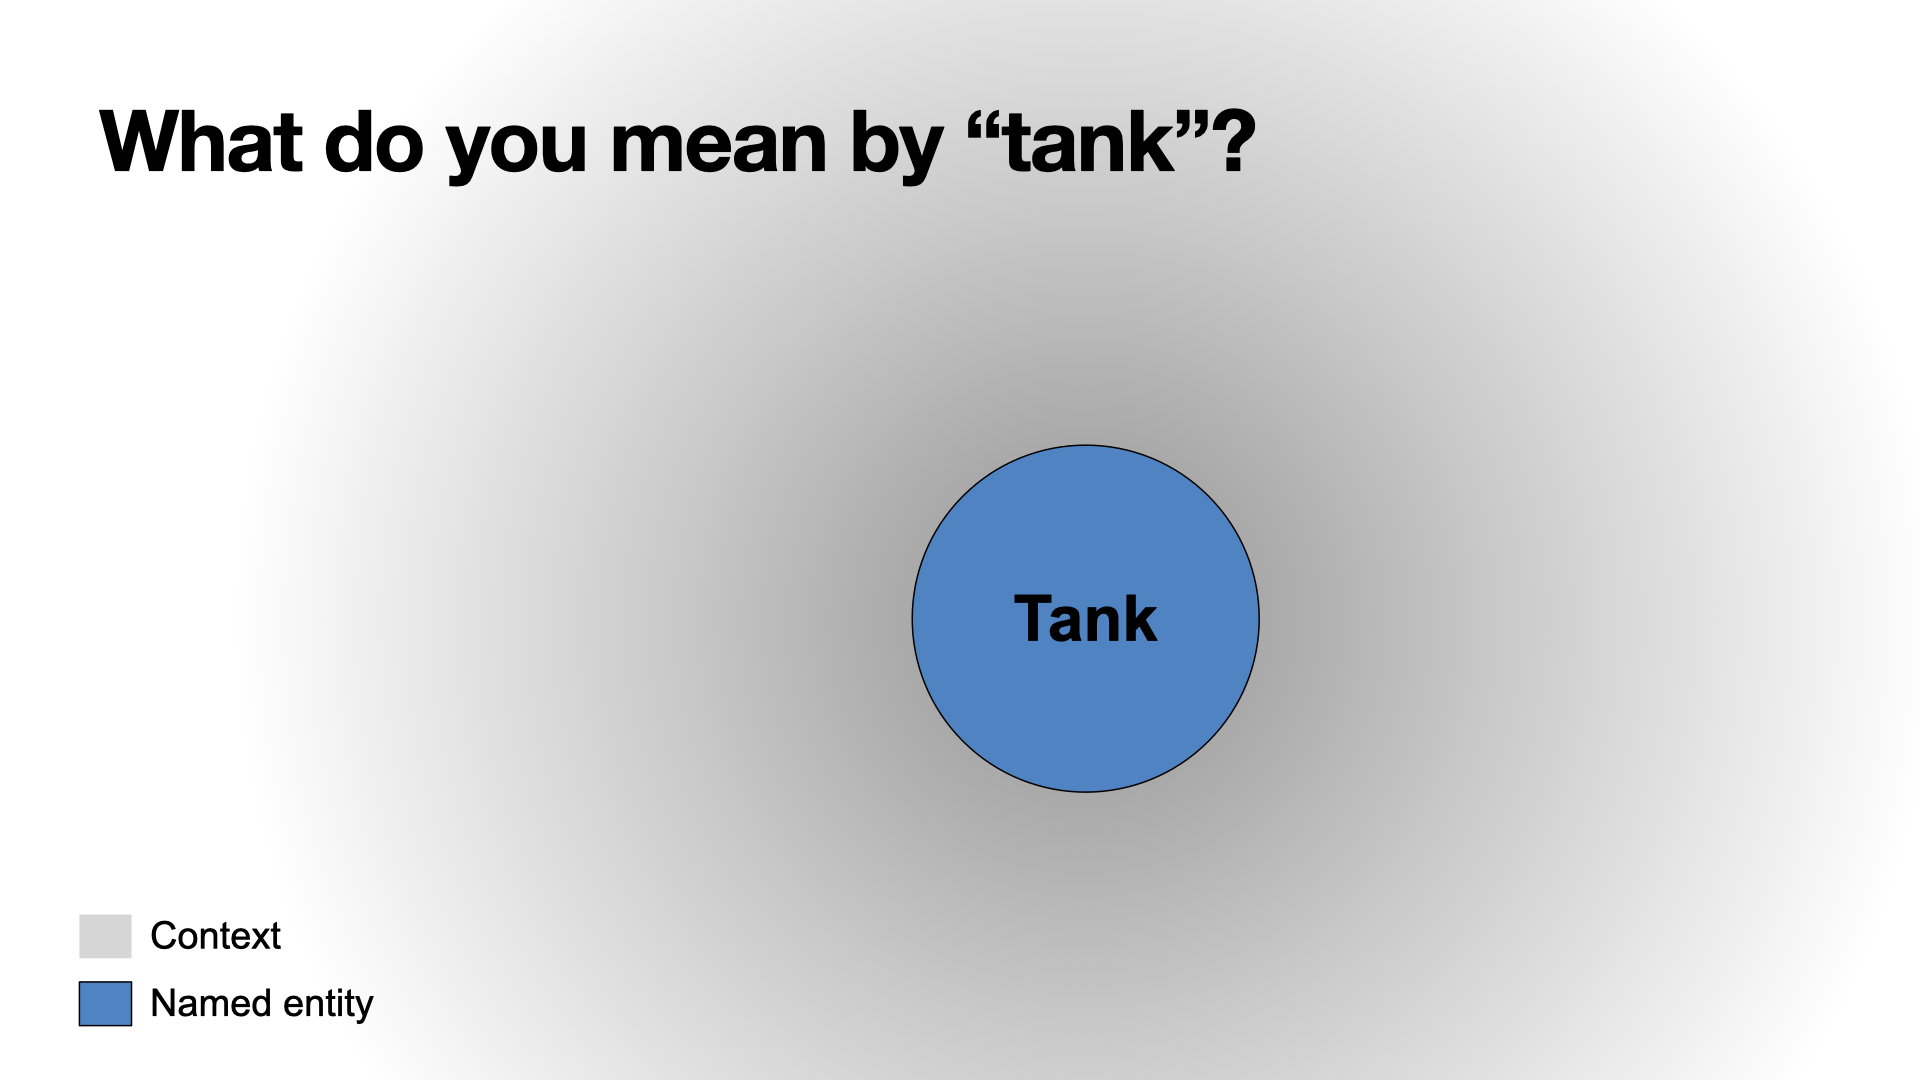
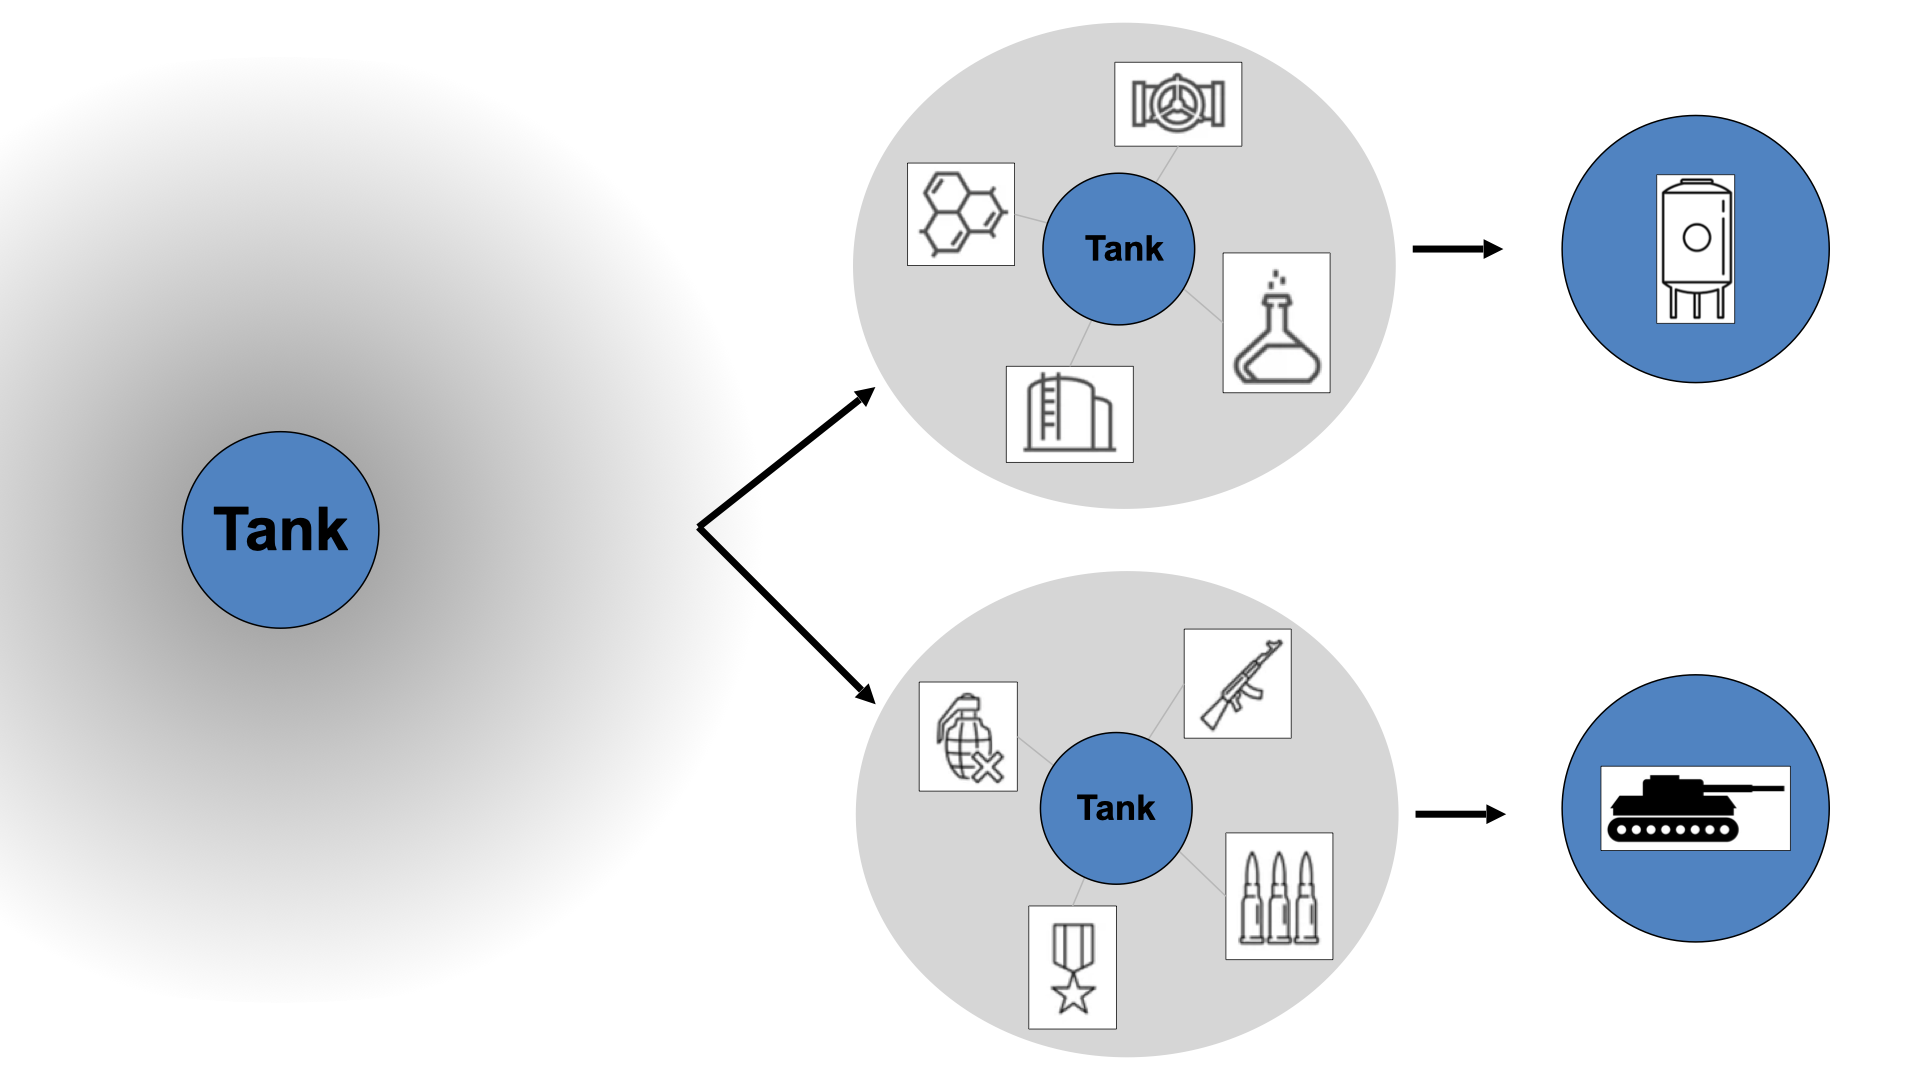
Context is key:
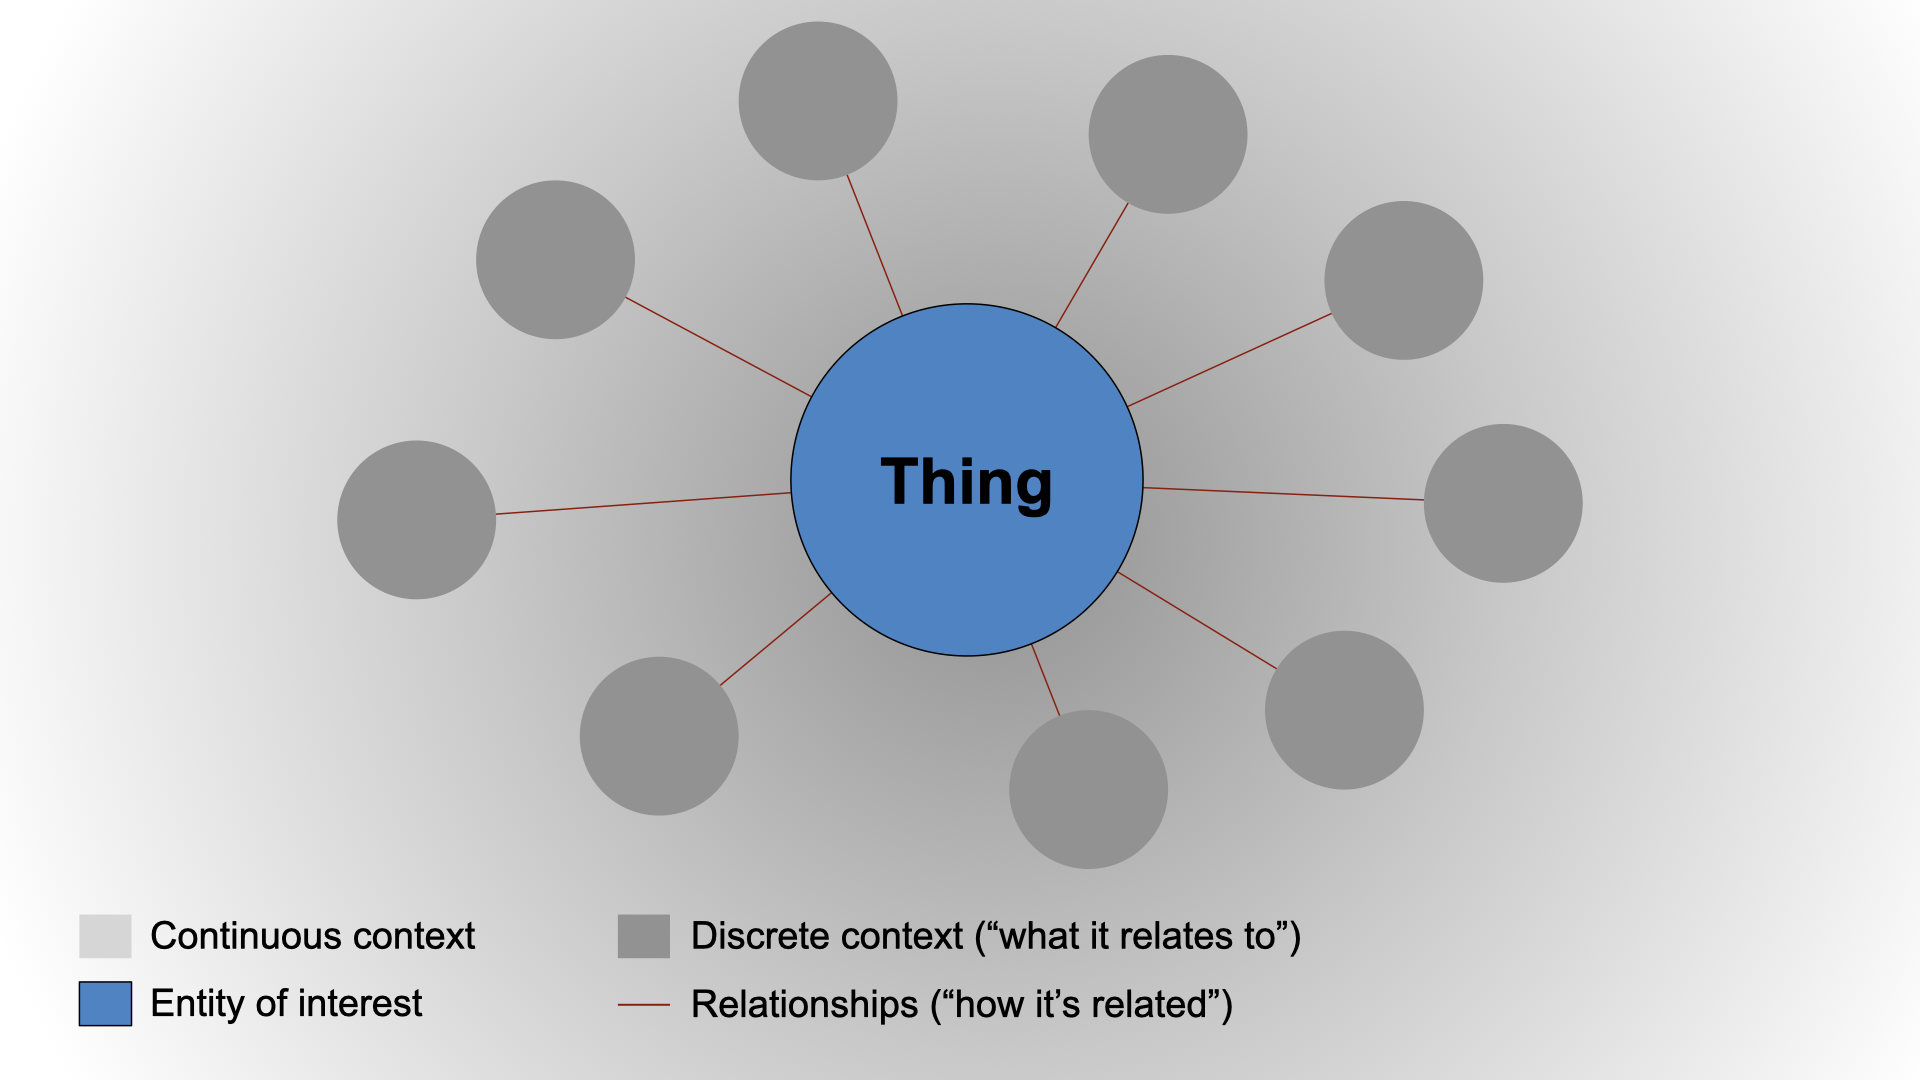
"Everything is defined by what it relates to and how it relates to it"
Tim-Berners Lee

Business context
Worldwide IT spending is projected to total $4.6 trillion in 2023, an increase of 5.1% from 2022.

- Information obesity: we generate more but understand less; our brains are overwhelmed and addicted (every new like, information generates dopamine release in the brain)
- Time or dynamics: components within a complex system change faster and faster over time
- Variability: high degree of variability or uncertainty in the components
- Vulnerability: complex systems are more susceptible to disruptions or failures
- Correlation: components within a complex system are more or less related and their interactions affect each other

Sources of complexity
What is complexity?
Didn't you notice?
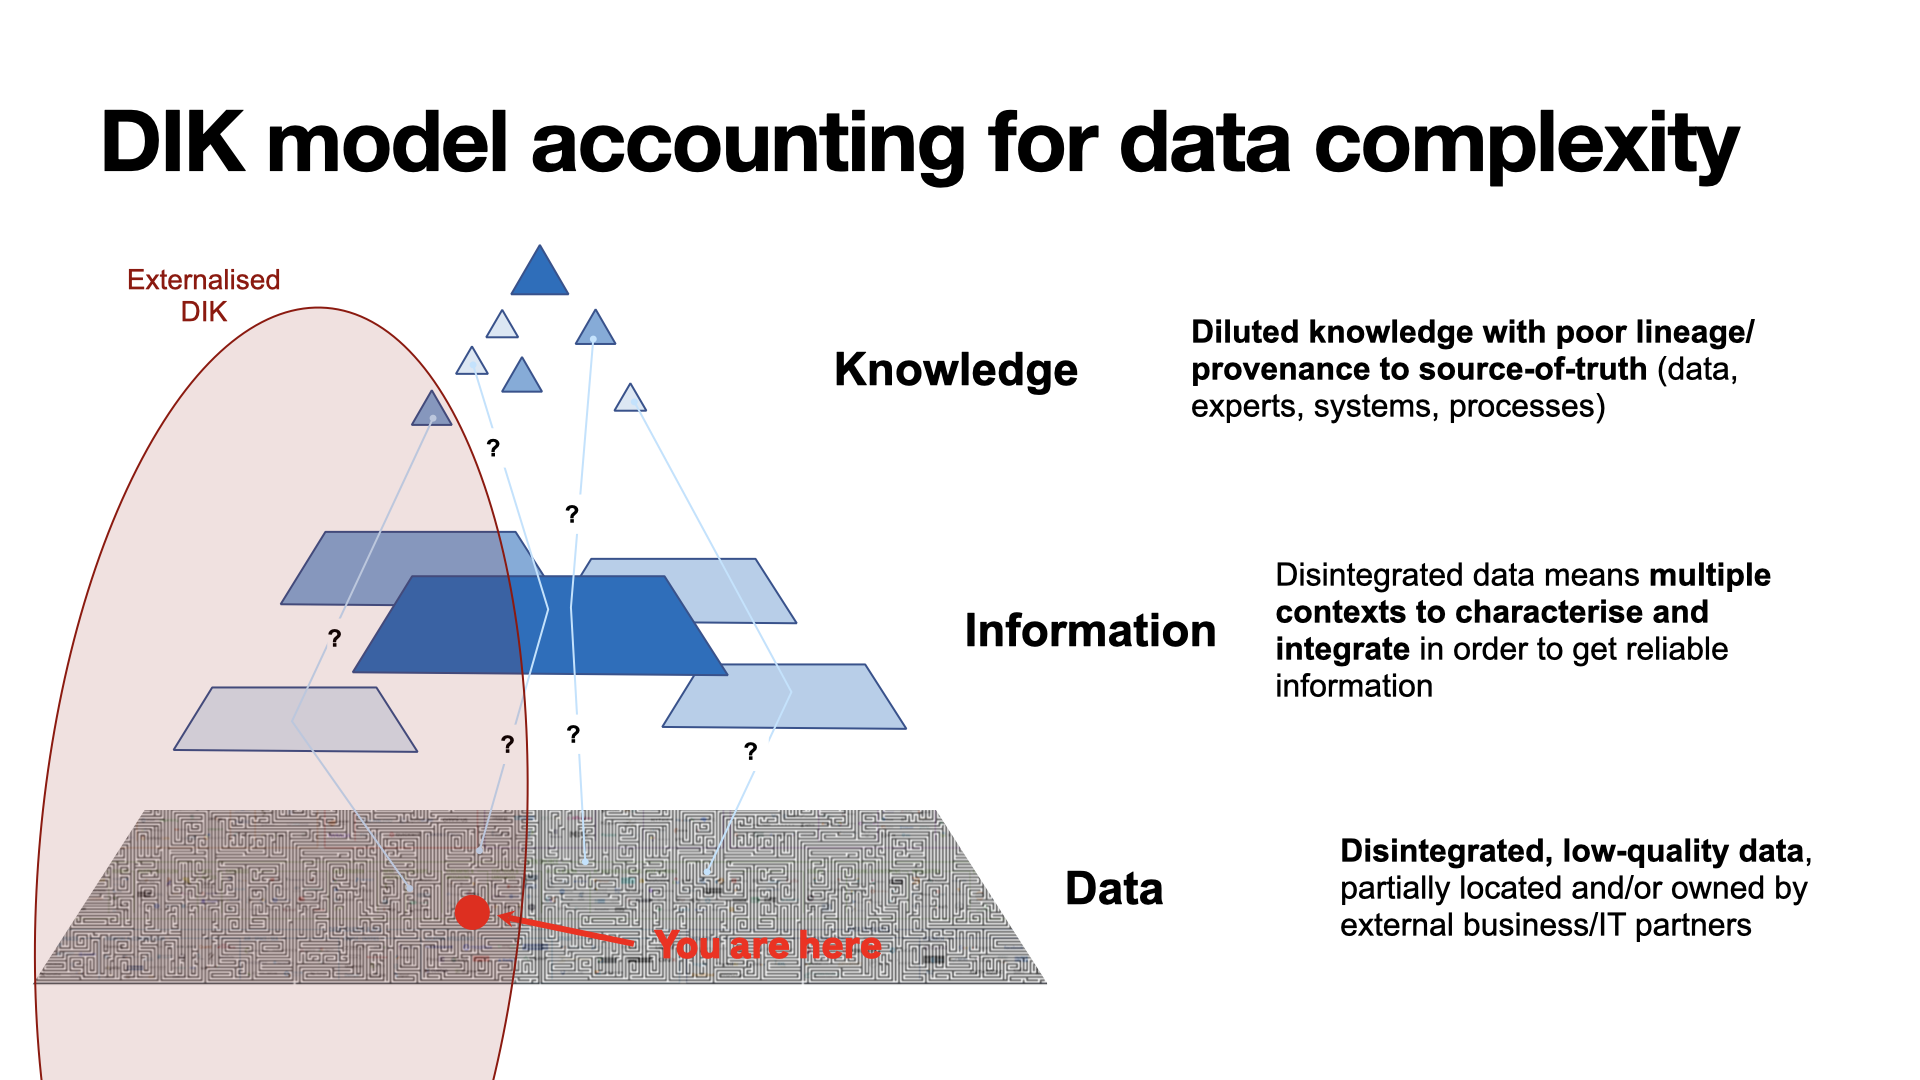
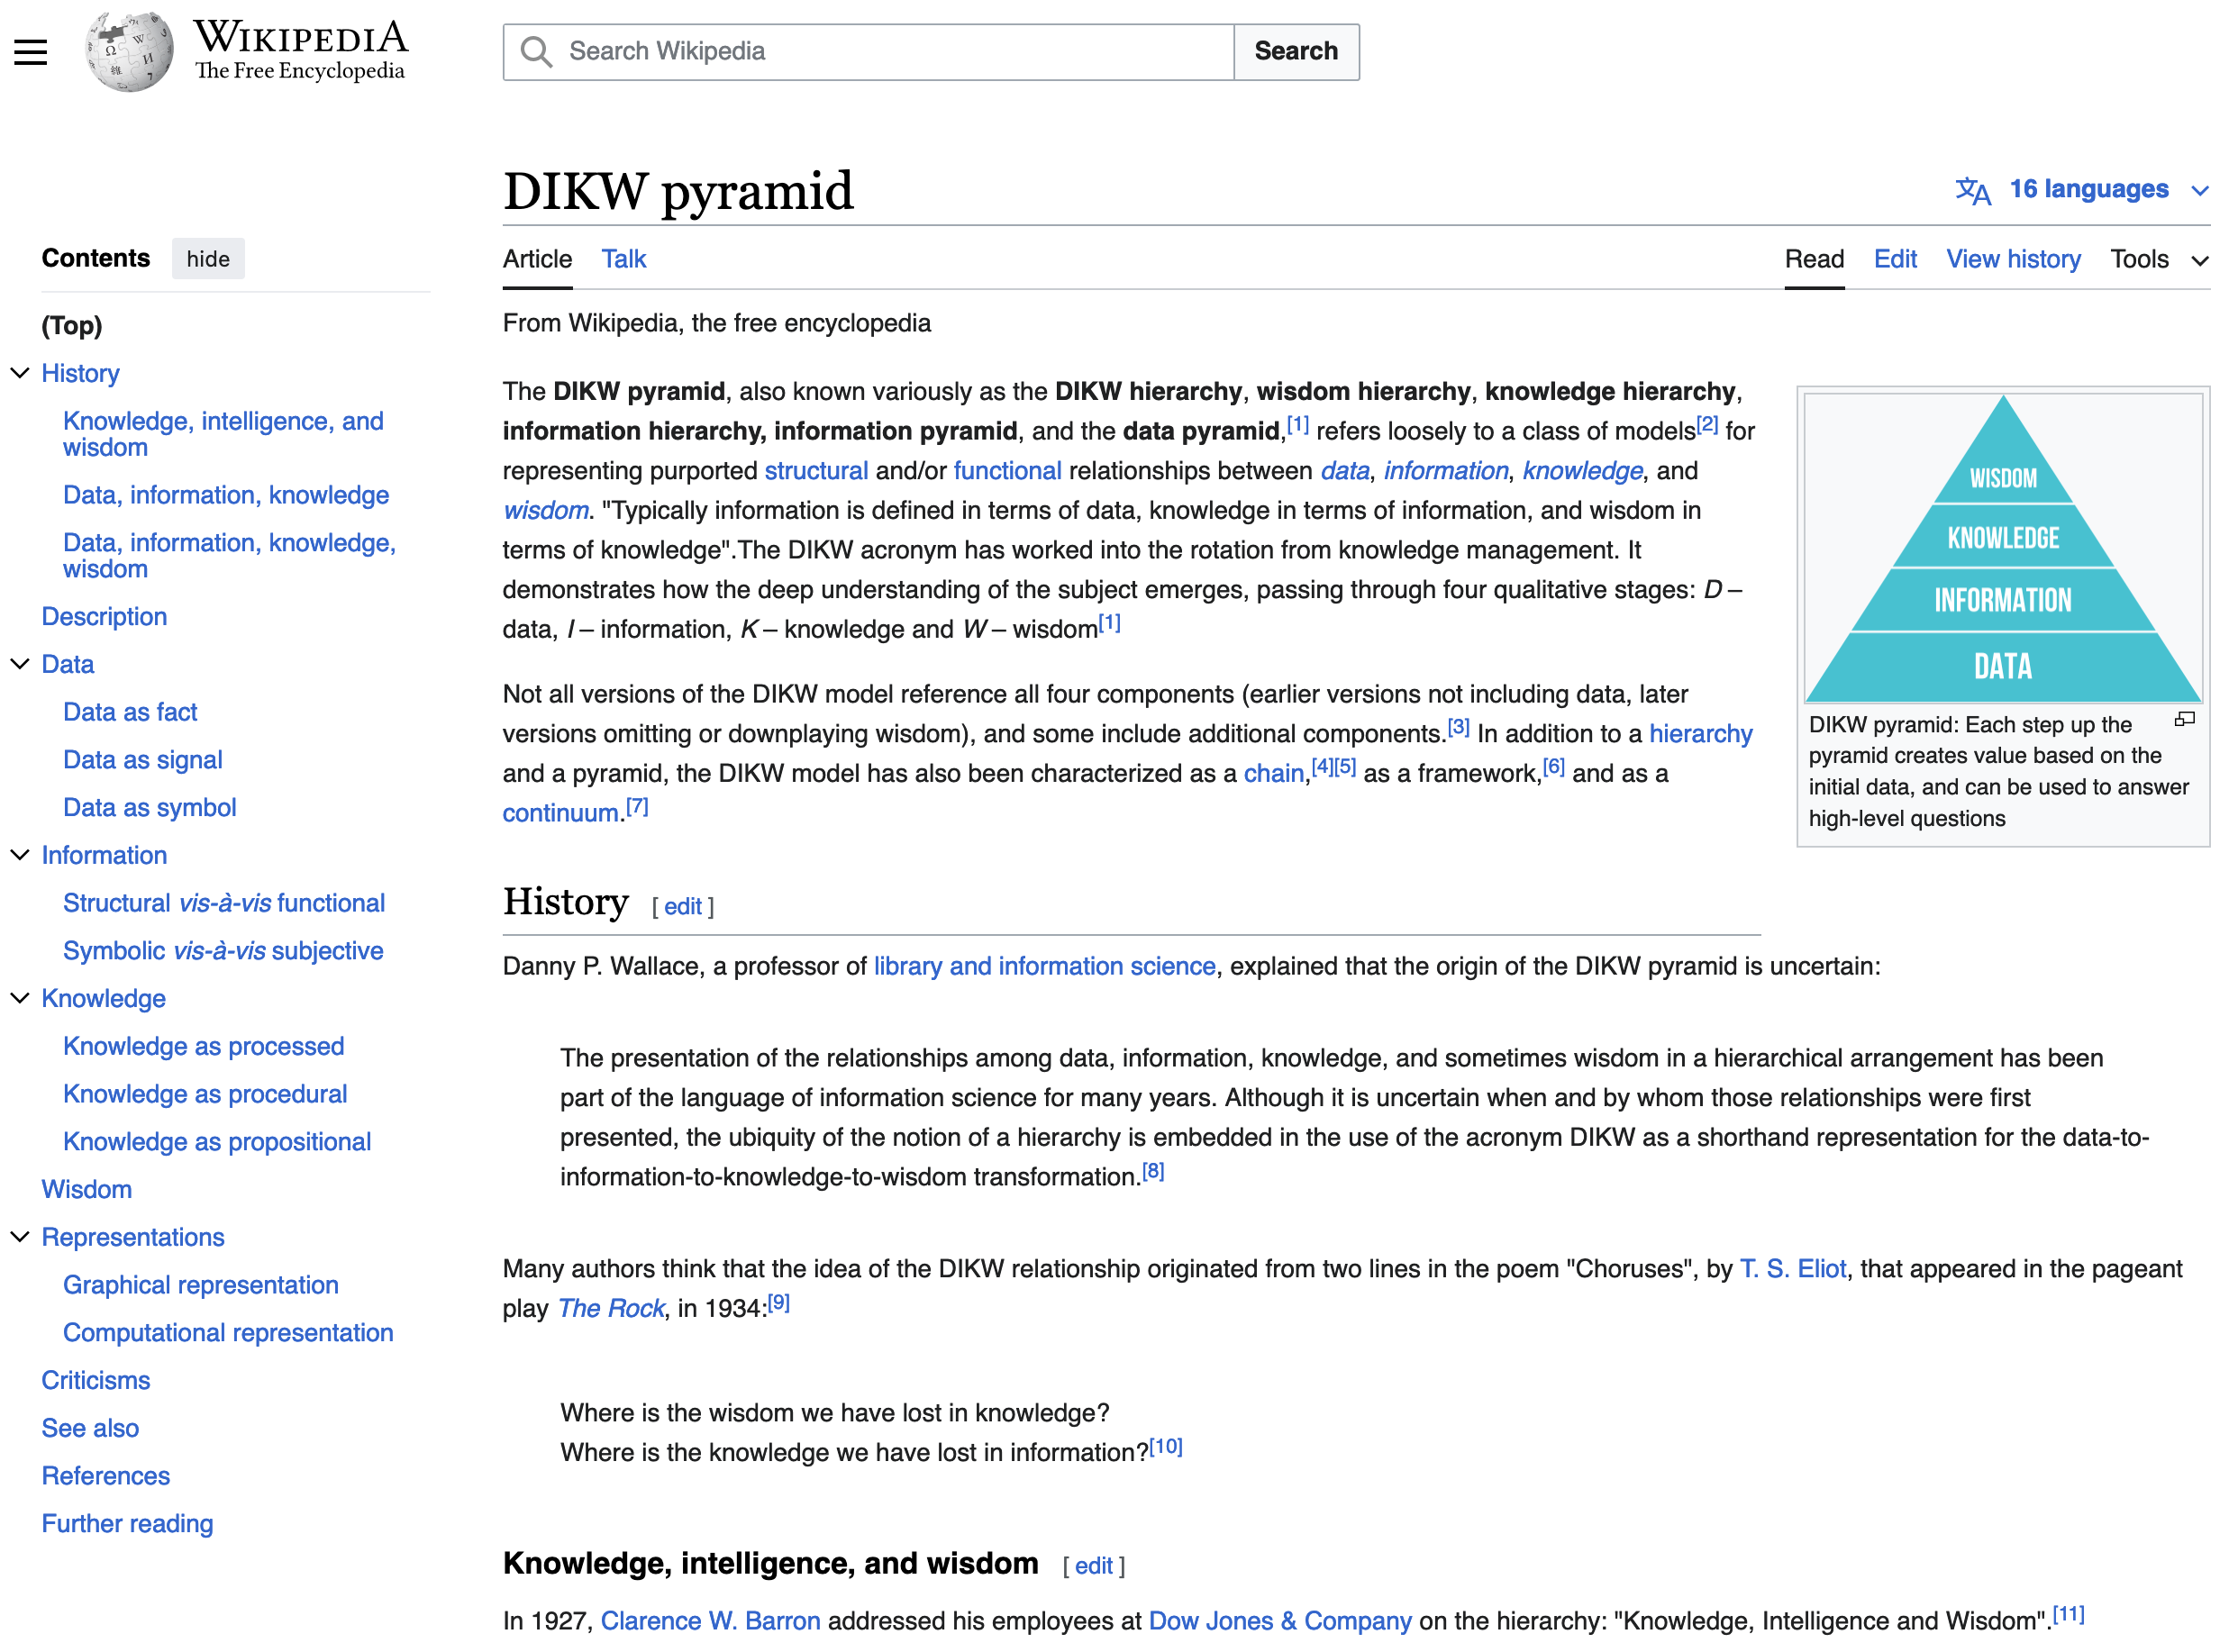
Data
System
DIKW
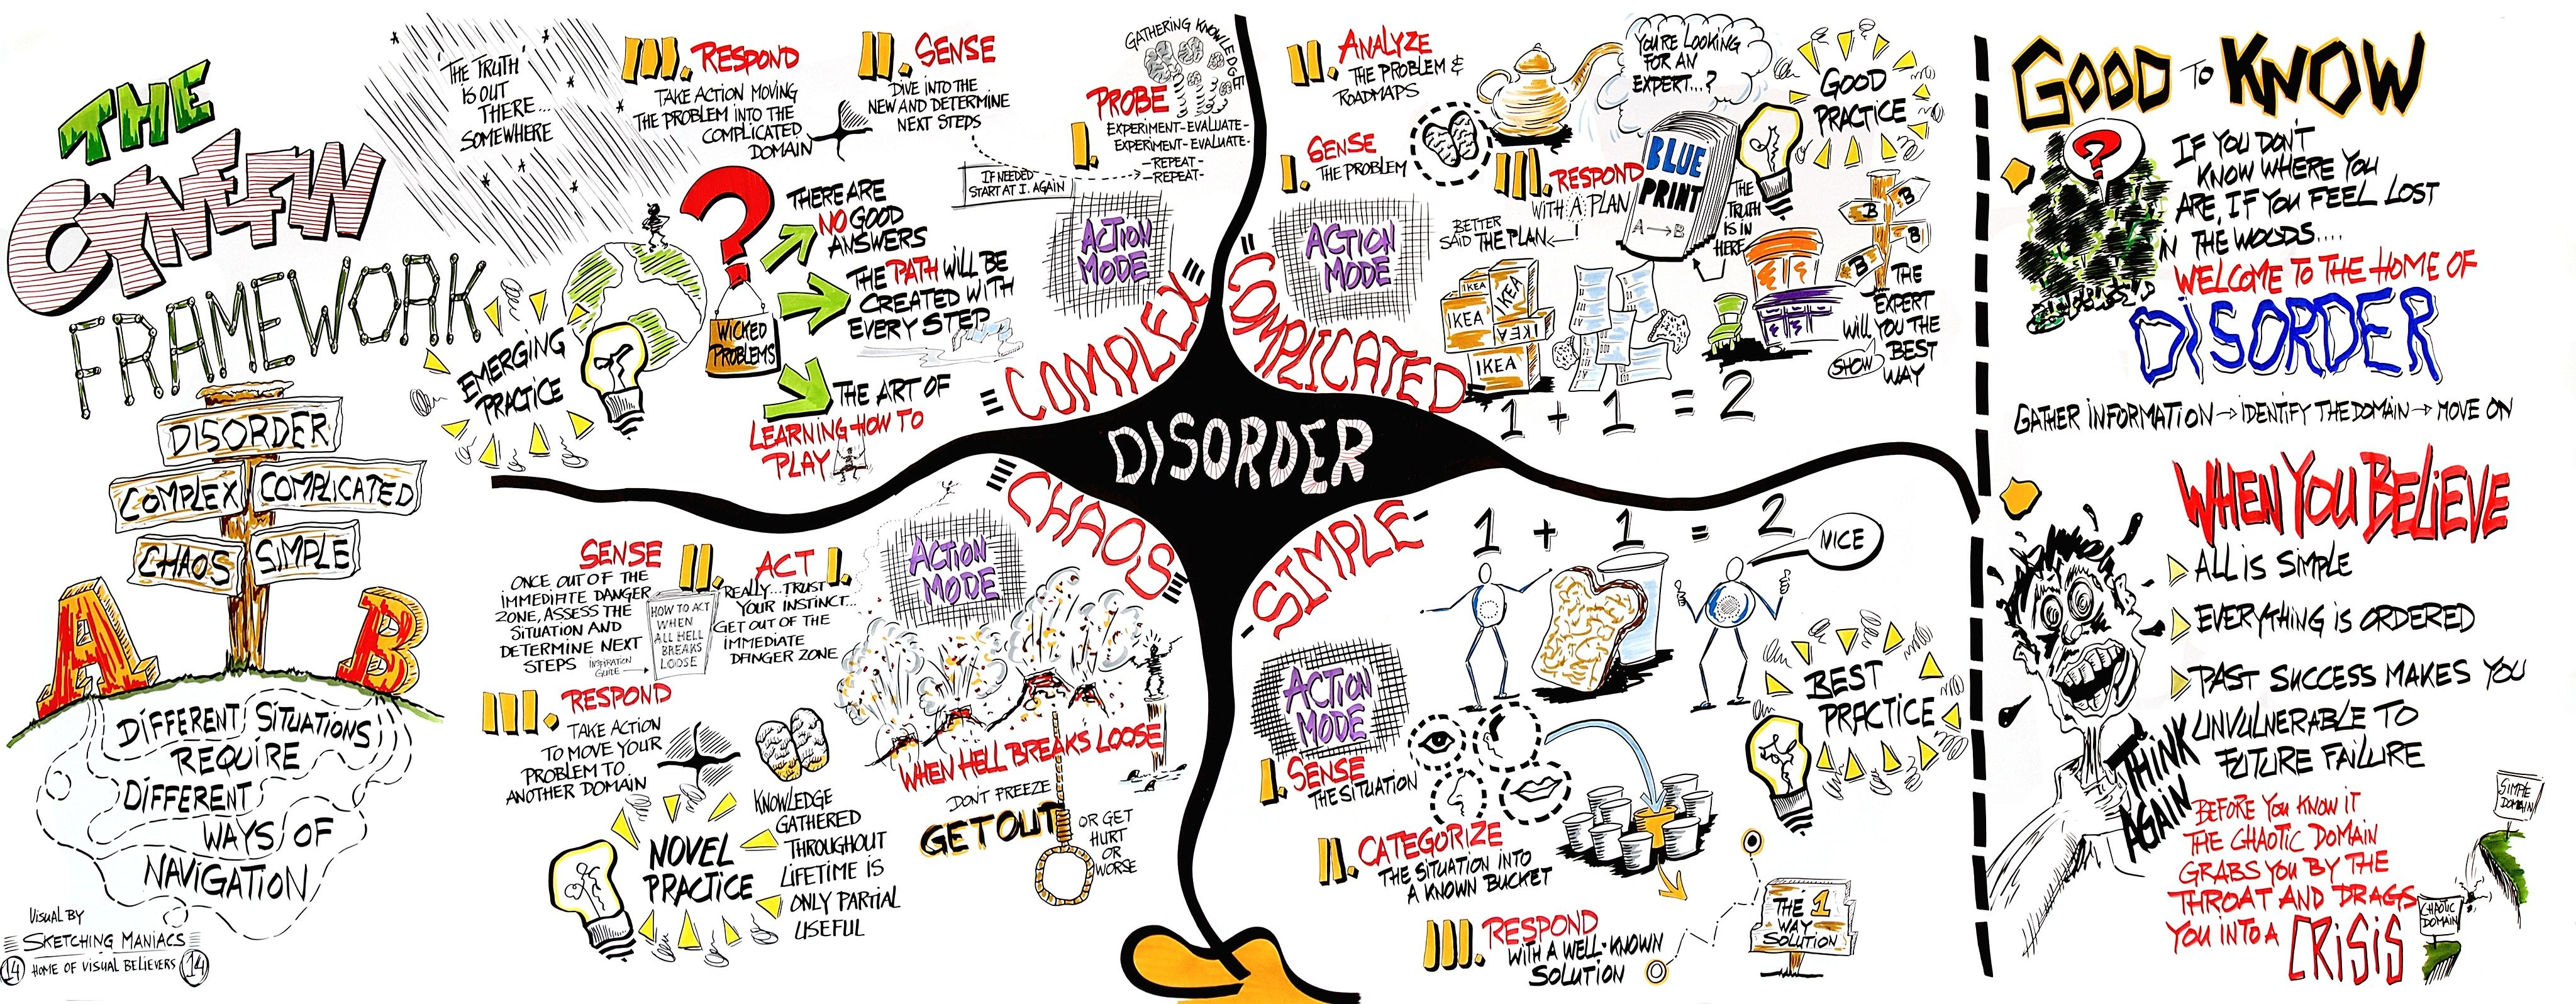
Definition: a framework is a problem-solving tool designed to assist decision-making. It is a conceptual framework that helps decision-makers see things from a new viewpoint, assimilate complex concepts, and make informed decisions in a variety of contexts
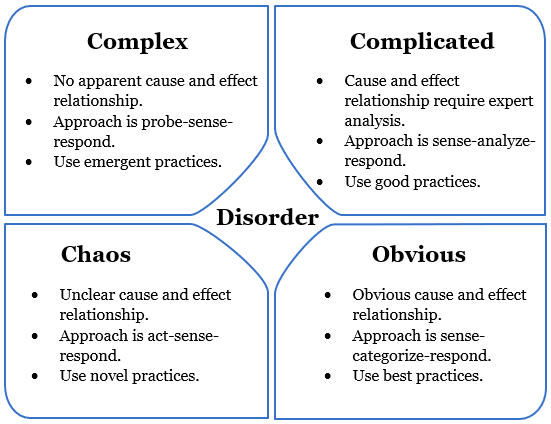
Clear = domain of the "known knowns"
Complicated = domain of the "known unknowns"
Complex = domain of the "unknown unknowns"
Chaos = cause and effect are unclear
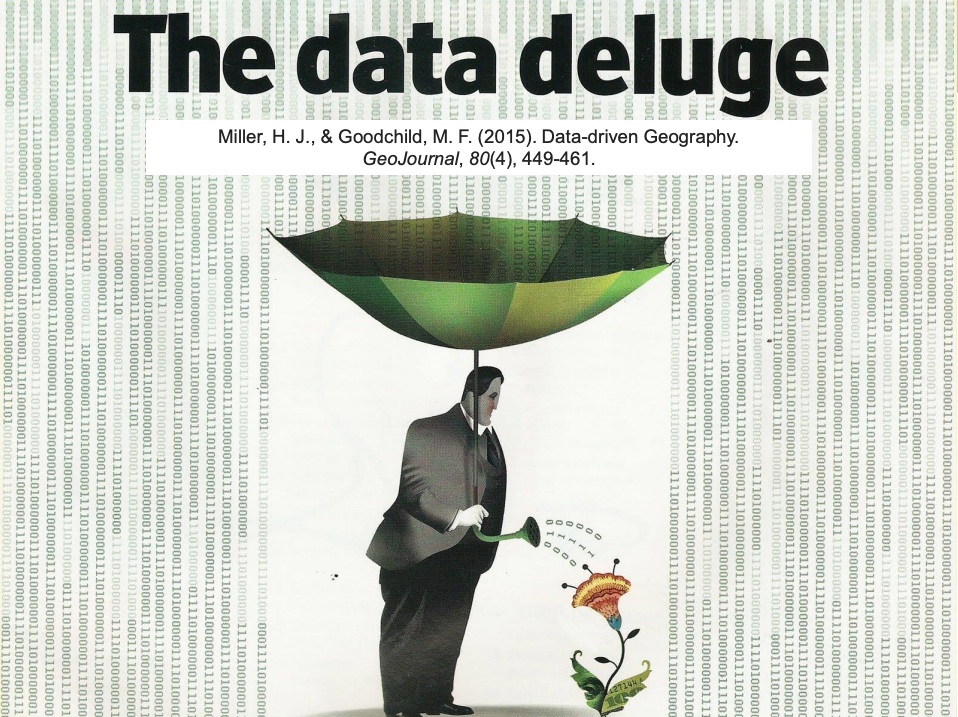
“The world is becoming more complex everyday and we understand less and less of it.”
-
The opinions expressed in this presentation and on the following canvas are solely those of the presenter.
-
Along the entire presentation, references are made to external artefacts. The source(s) are always mentioned.
-
Sources can point to commercial entities. I'm neither promoting these entities not their product or services. Just using digital material they produced to support the points of this course.
-
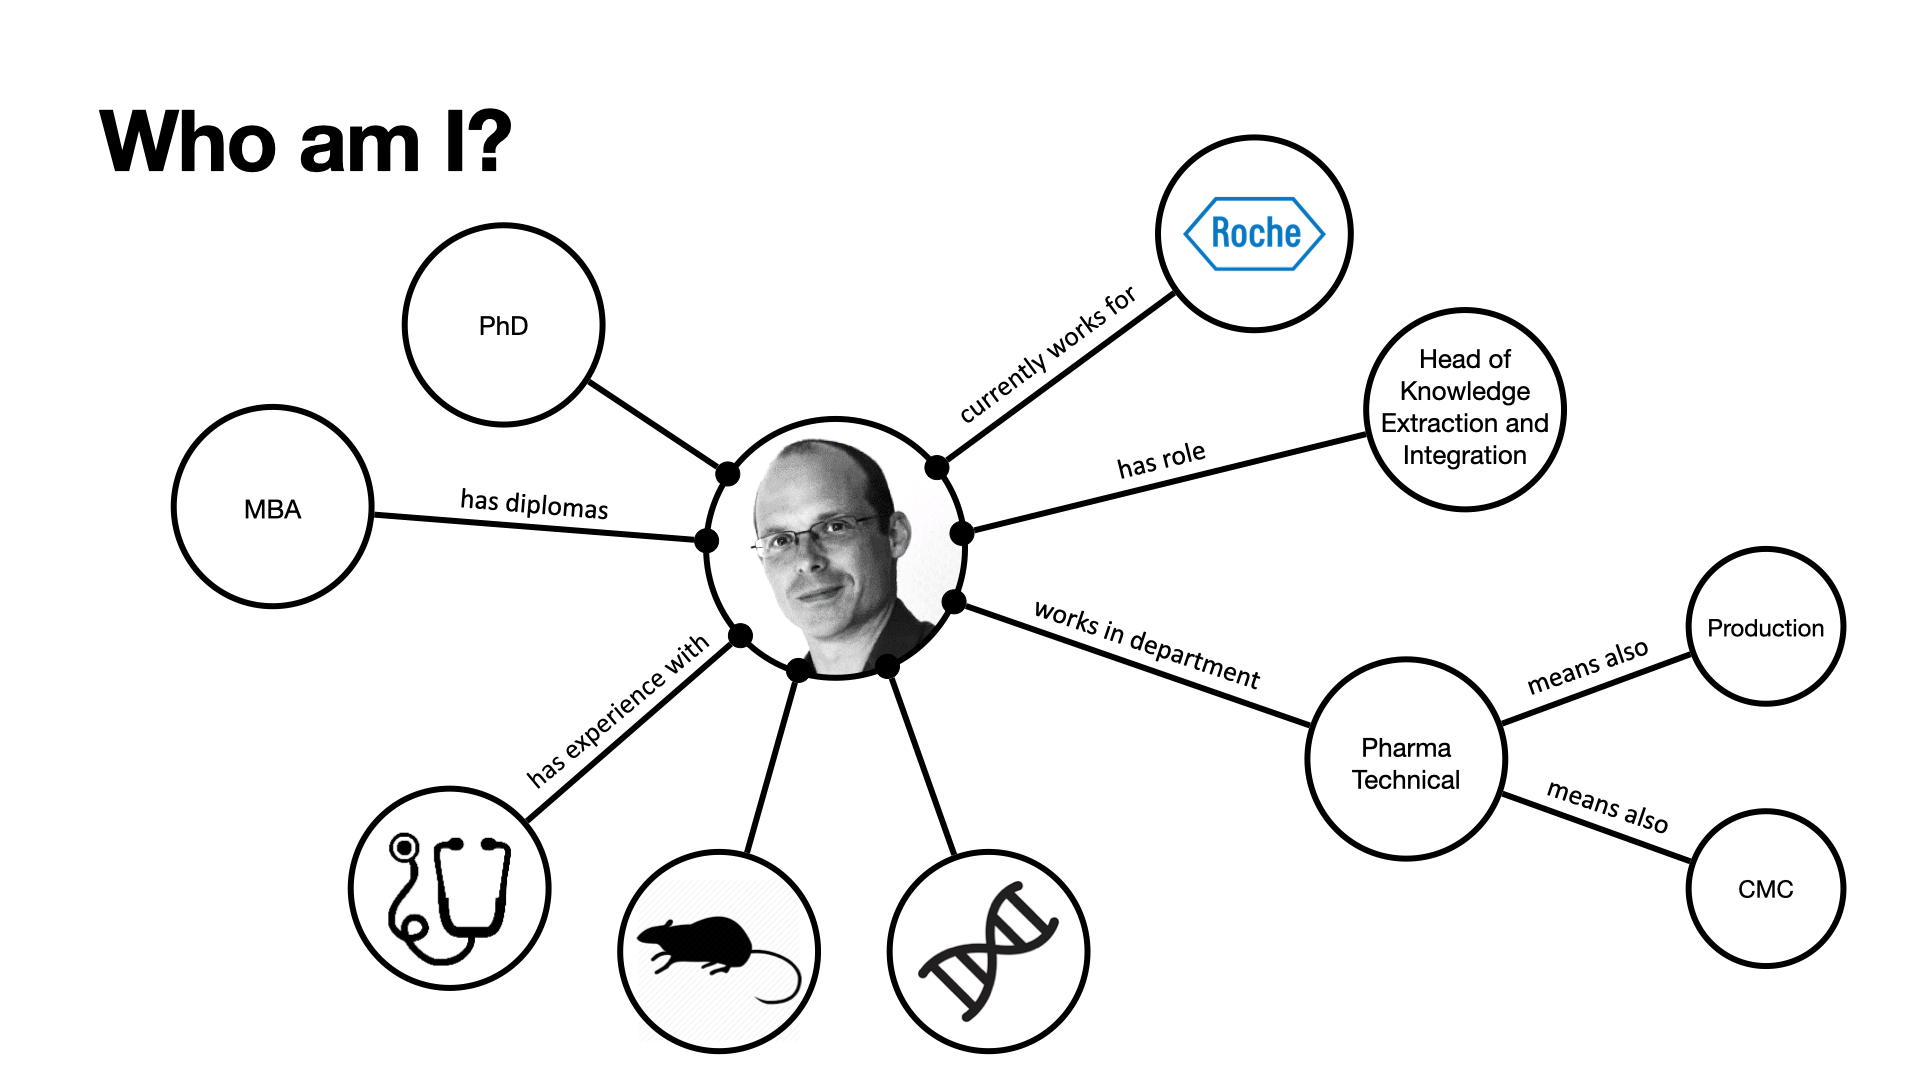
Neither an (IT) technical person, nor a data scientist
I) Realise and acknowledge how business digital complexity undermines our ability to understand end-to-end business in a systemic manner
15 min
Schedule:
Part I - Realise and acknowledge how business digital complexity undermines our ability to understand end-to-end business in a systemic manner
15 min
Part II - Discover new ways of working that leverage open standards to harness complexity, better understand and make fact-based decisions
- Hands-on conceptual modelling session (10 min)
- Hands-on filling out a project description form (10 min)
50 min
Part III - Concrete examples using a knowledge graph to measure business value delivery using an enterprise architecture ontology
Conclusion
15 min
Abstract:
Our digital world is becoming more complex everyday and we understand less and less of it. Without a proper digital transformation, the daily-growing digital complexity underpinning any modern business overwhelms human brain's cognition. We've reached a point where we need machines to help us understand a machine-generated digital complexity, including the monitoring of projects' added value.
Data-centric business value monitoring:
how Data Governance 4.0 enables agile impact assessment of project delivering digital products/services in a VUCA environment.
Cedric Berger, PhD MBA (cedricberger@protonmail.com)
April 4th, 2024
SMP workshop, UniL, Lausanne, Switzerland
Project
Name:
Date created:
Date initiated:
Objectives:
Key results:
...
Scope
Business domain:
Use cases:
...
Budget
Initial amount:
Usage:
...
Timelines
Kickoff data:
Milestones:
...
Solutions
Vendors
Regulation
Communication
Stakeholder
First name:
Last name:
Role:
RACI:
...
Infinitely extendable description of project context
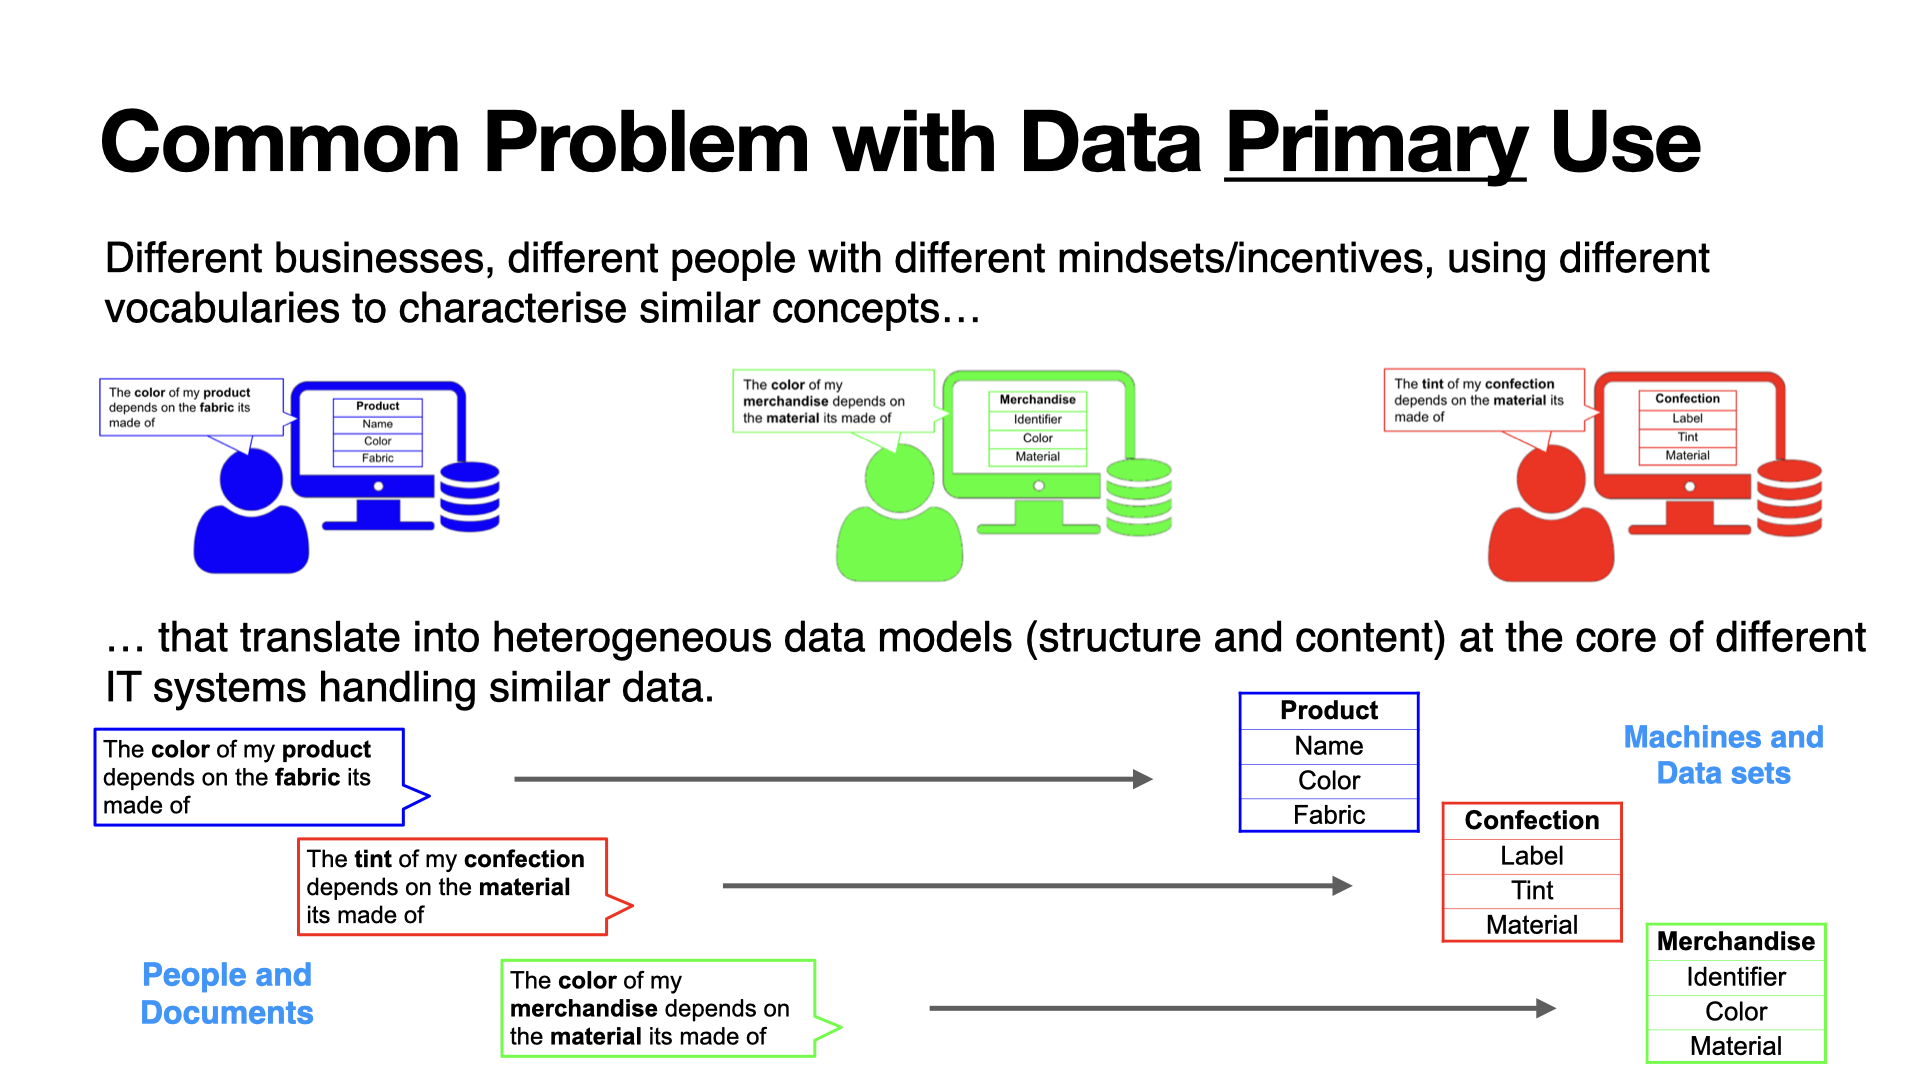
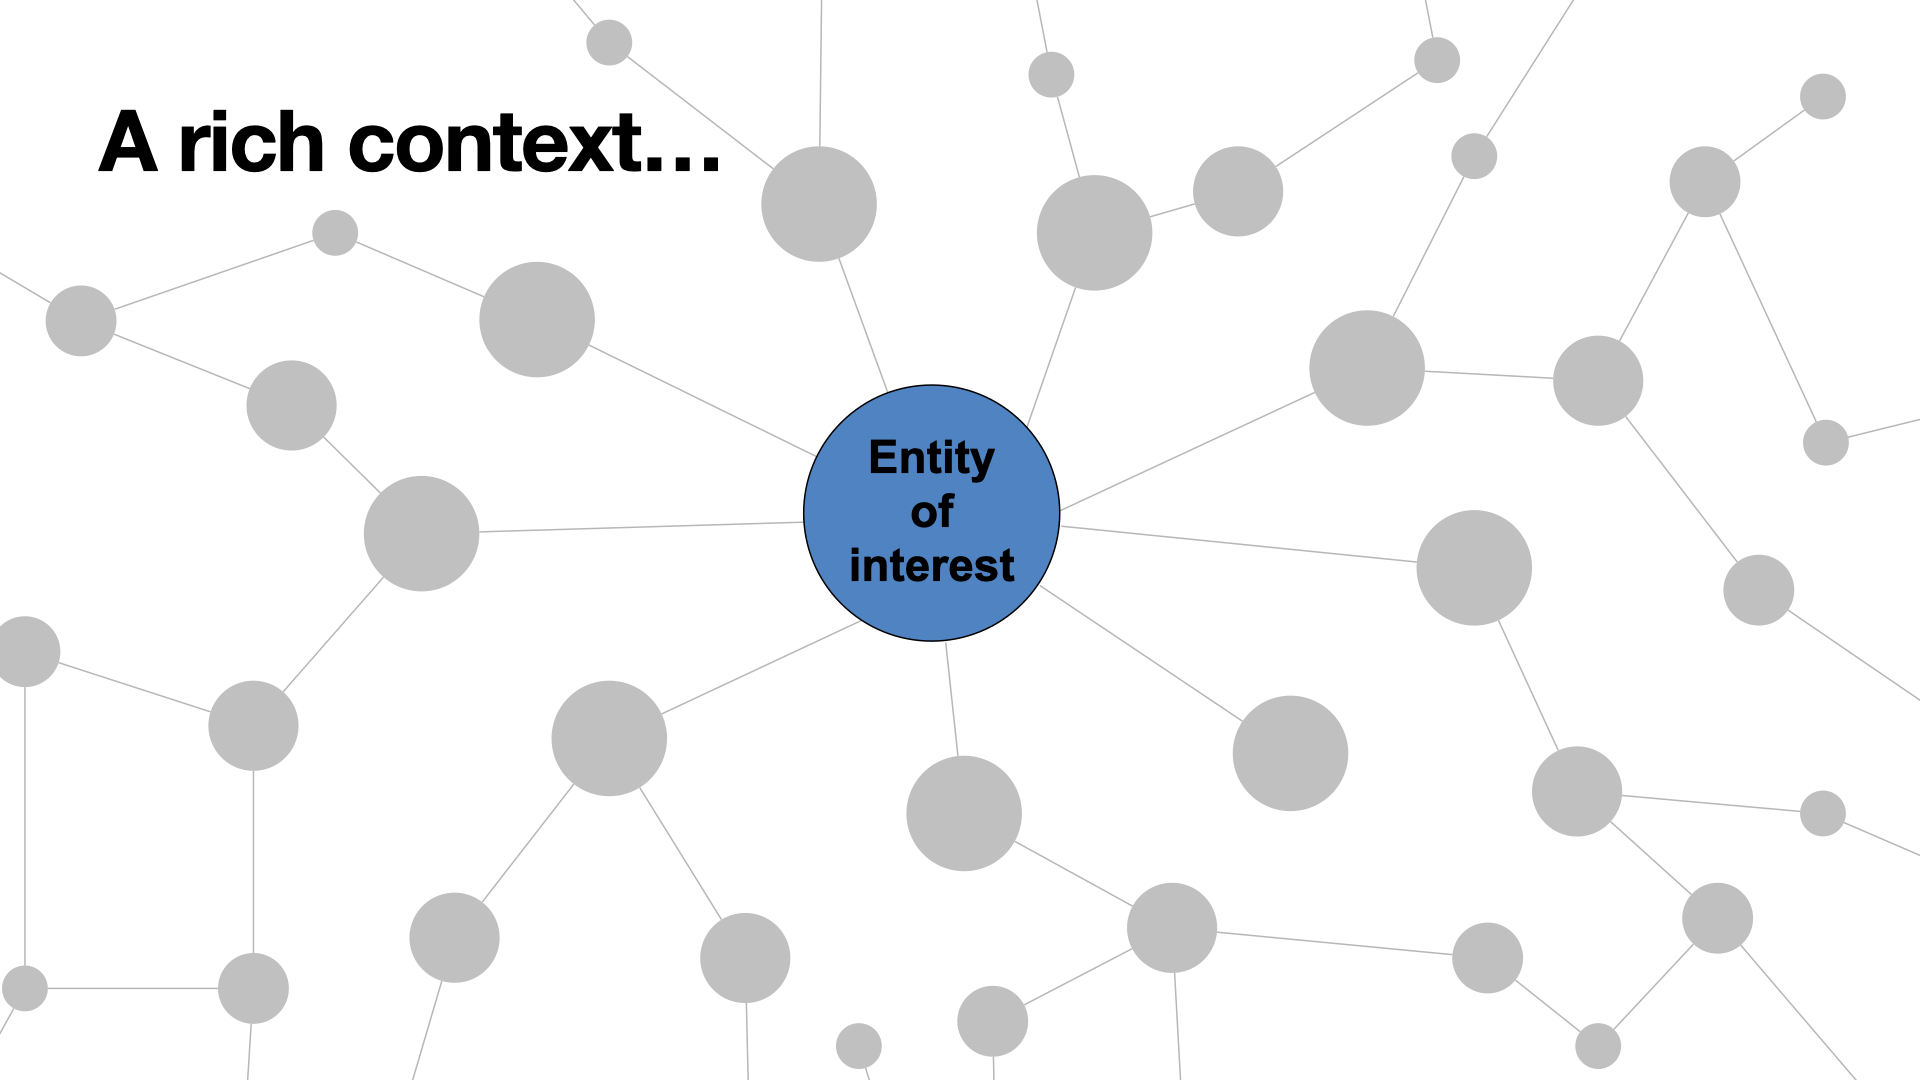
Definition: Entities and relationship related to (or relevant to) an asset, an action, a situation of interest. All entities and relationships not characterising the asset, action or situation itself but acting upon it and surrounding it concomitantly.
If you don't define the context, your don't define things (including business needs/requirements)
It is important to capture methodically and digitally business context. Why?
- it clarifies misunderstandings and align people's effort
- it is reusable all across your organization, industry, world
- it enables transparent and fact-based (links to sources) communication to enforce trust
Systems thinking is a way of making sense of the complexity of the world by looking at it in terms of wholes and relationships rather than by splitting it down into its parts. It has been used as a way of exploring and developing effective action in complex contexts, enabling systems change. Systems thinking draws on and contributes to systems theory and the system sciences. See Dana Meadows, Thinking In Systems: A Primer
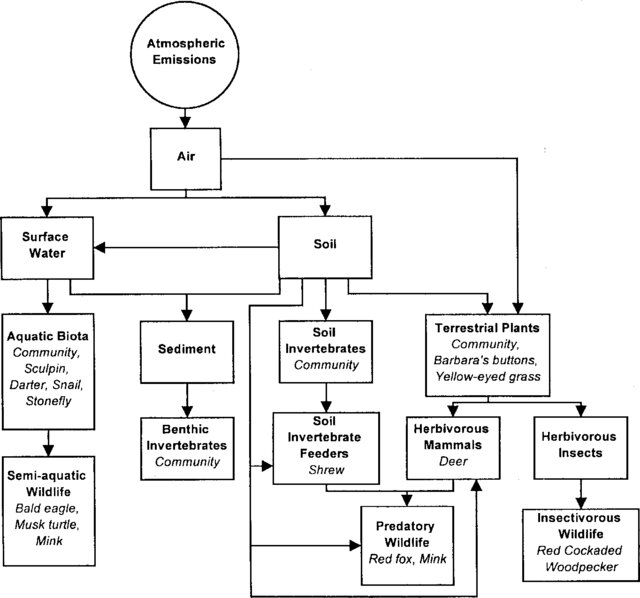
Chemical contamination
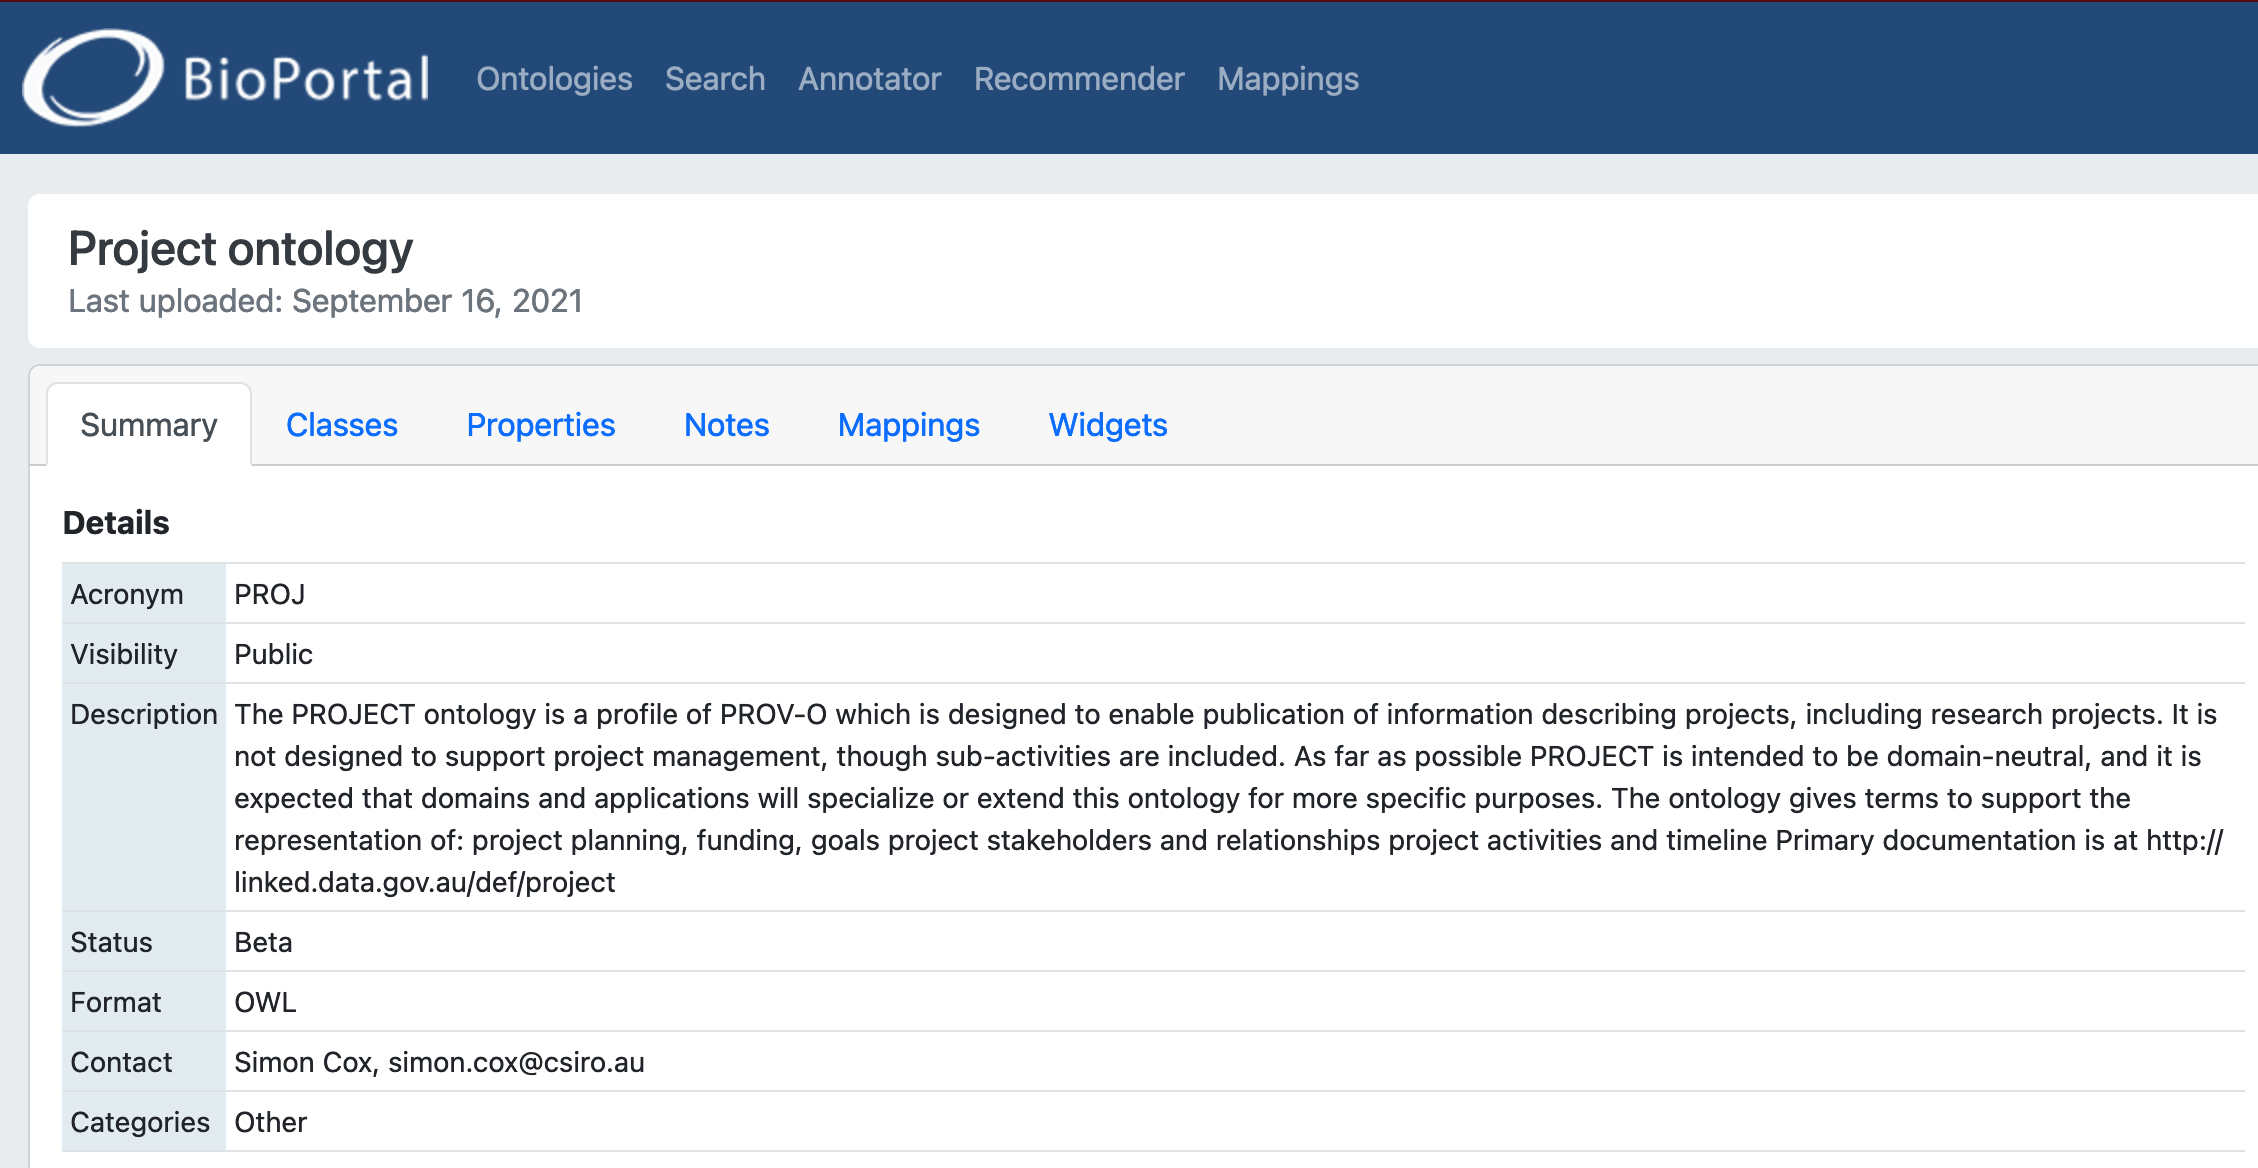
Predefined ID card for each key concepts required for PM, their respective properties/attributes and relationships linking them conceptually.
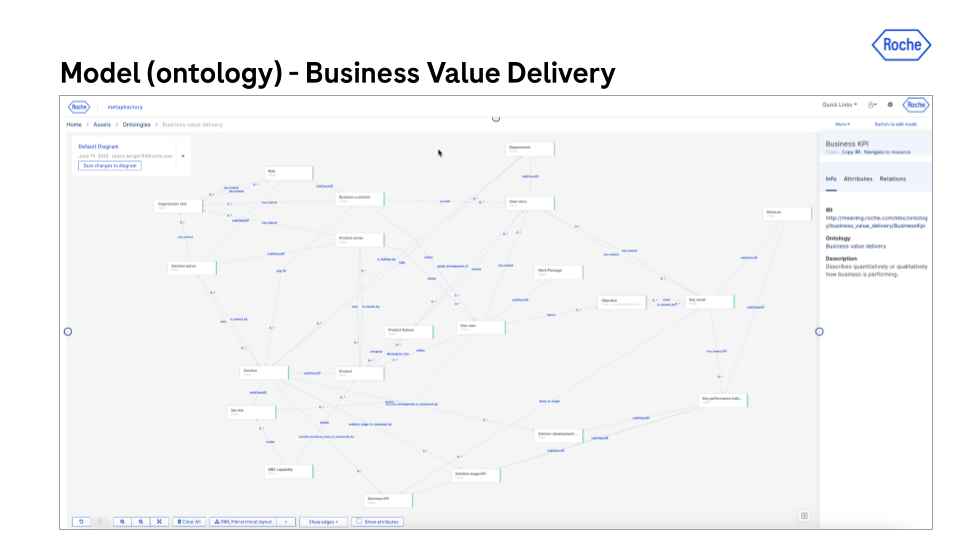
Project ontology
Project ontology
... adding contextual information that captured nowhere in your organization
Project
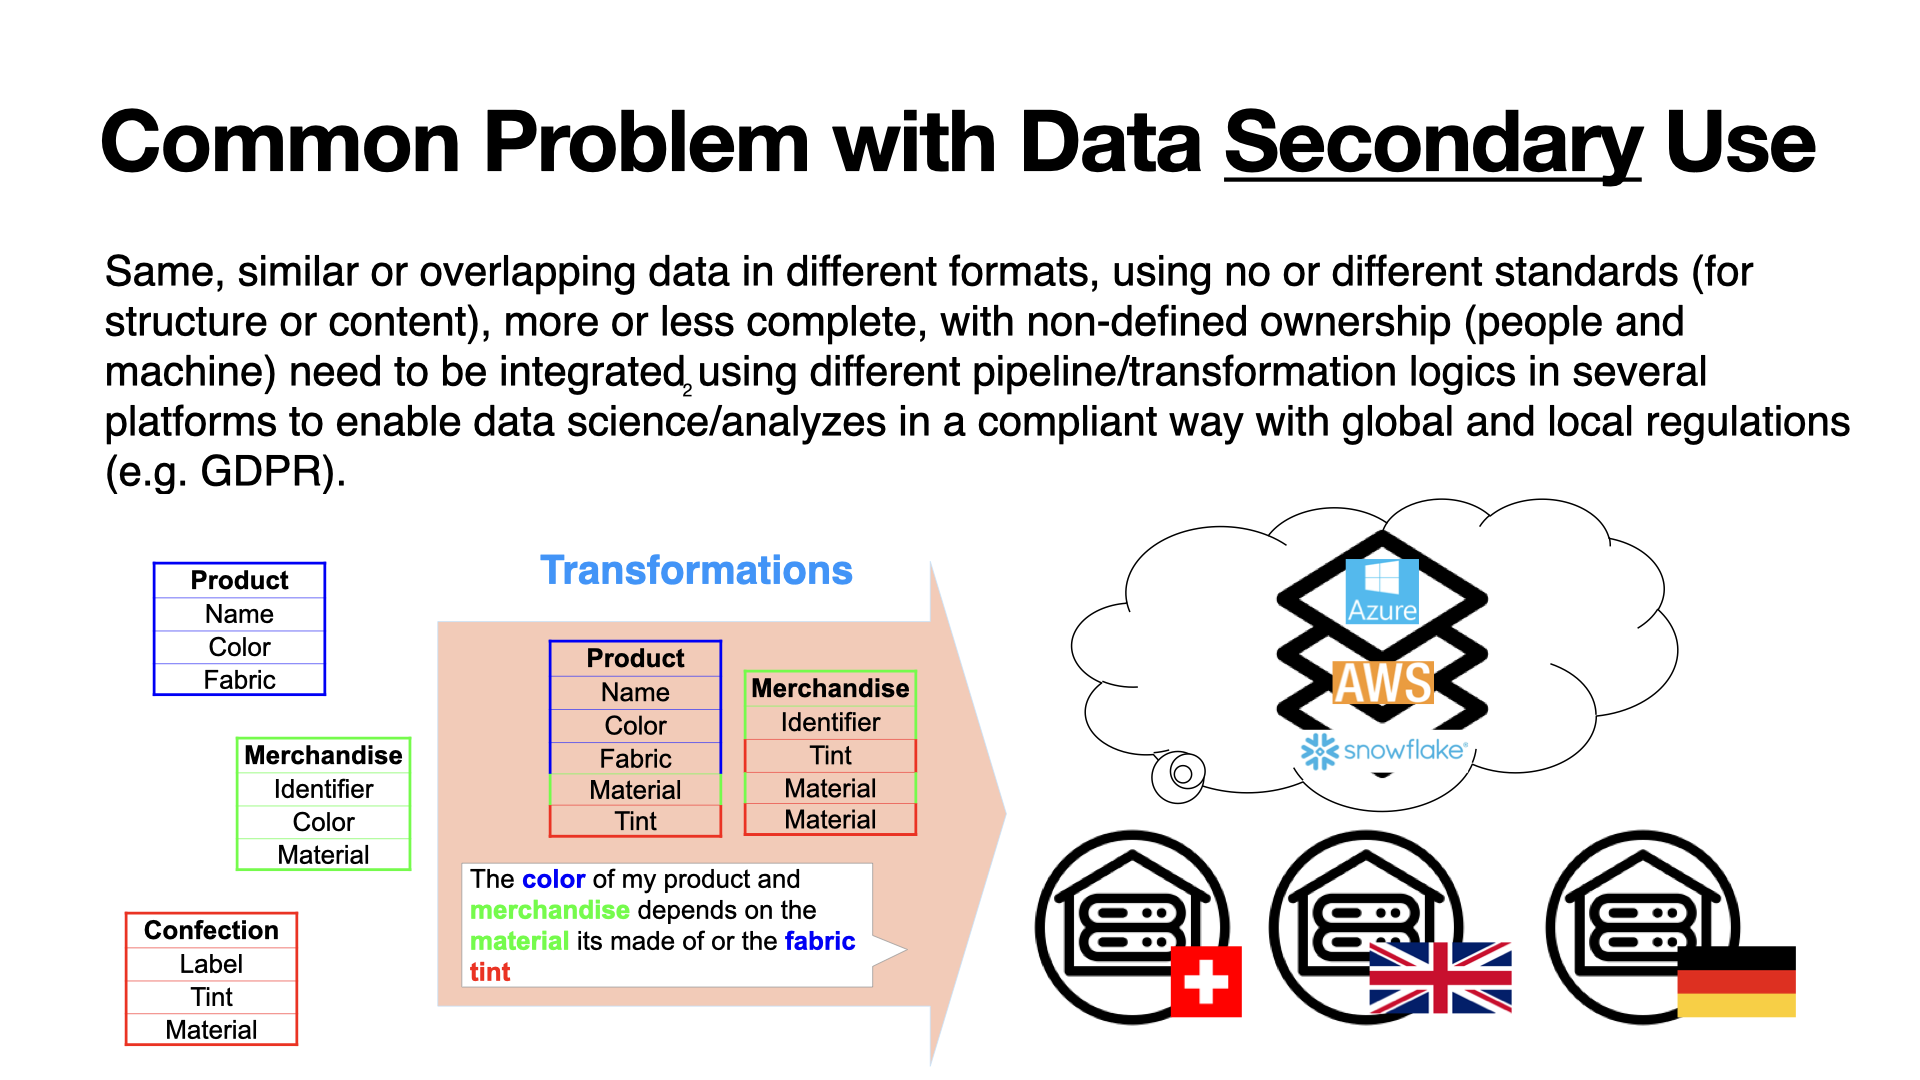
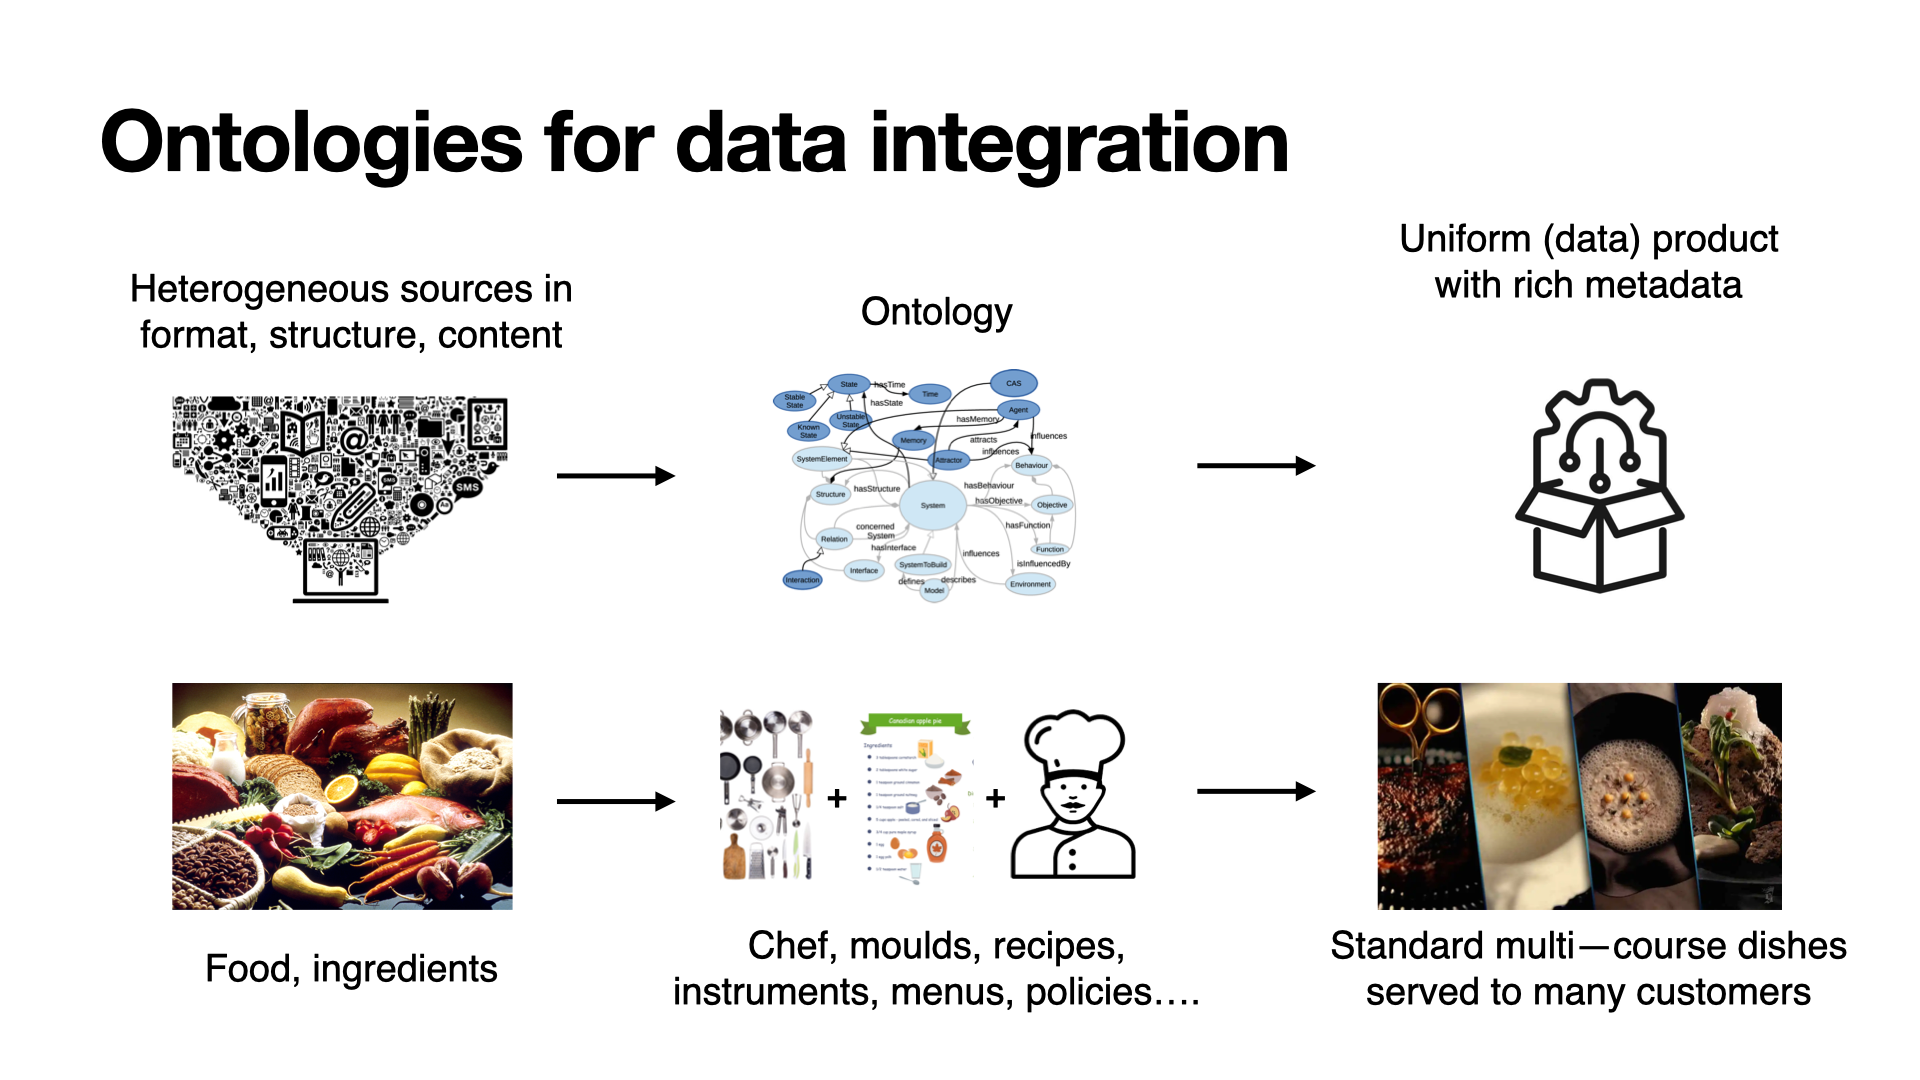
... simplifying complex data integration by surfacing only what is needed to answer specific questions
Flexibility with integrating heterogeneous sources of data in
... breaking (digital) silos and linking data from unlinked system (without adding/modifying physical system integration)
Flexibility in adding new data
Flexibility with showing complexity/granularity at will
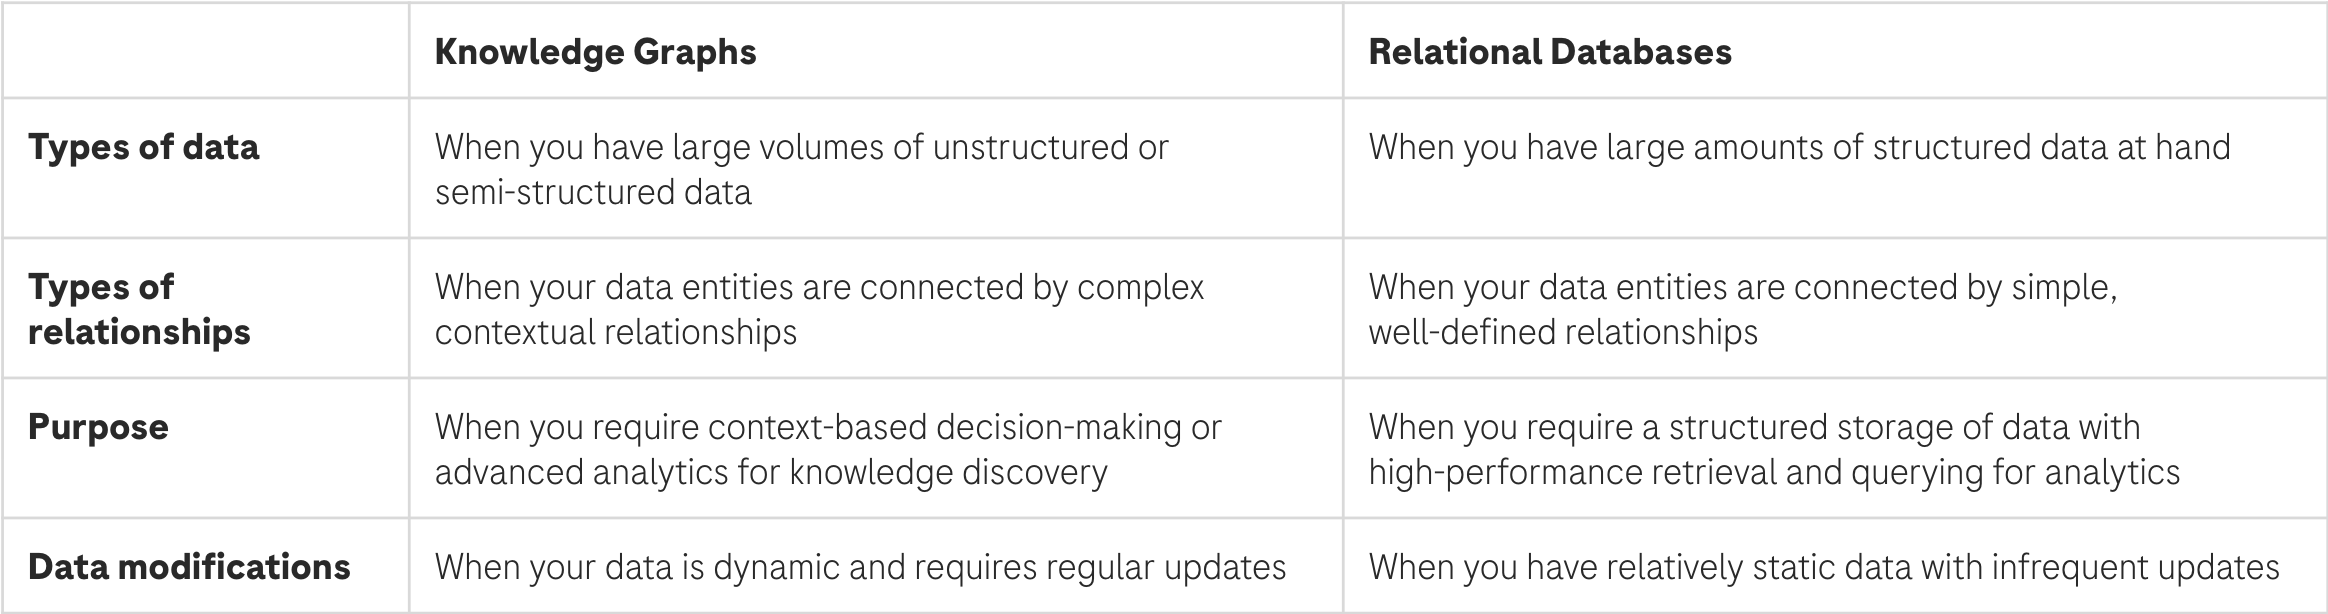
Why not using a normal system with a relational tabular database?
Agility

Team work
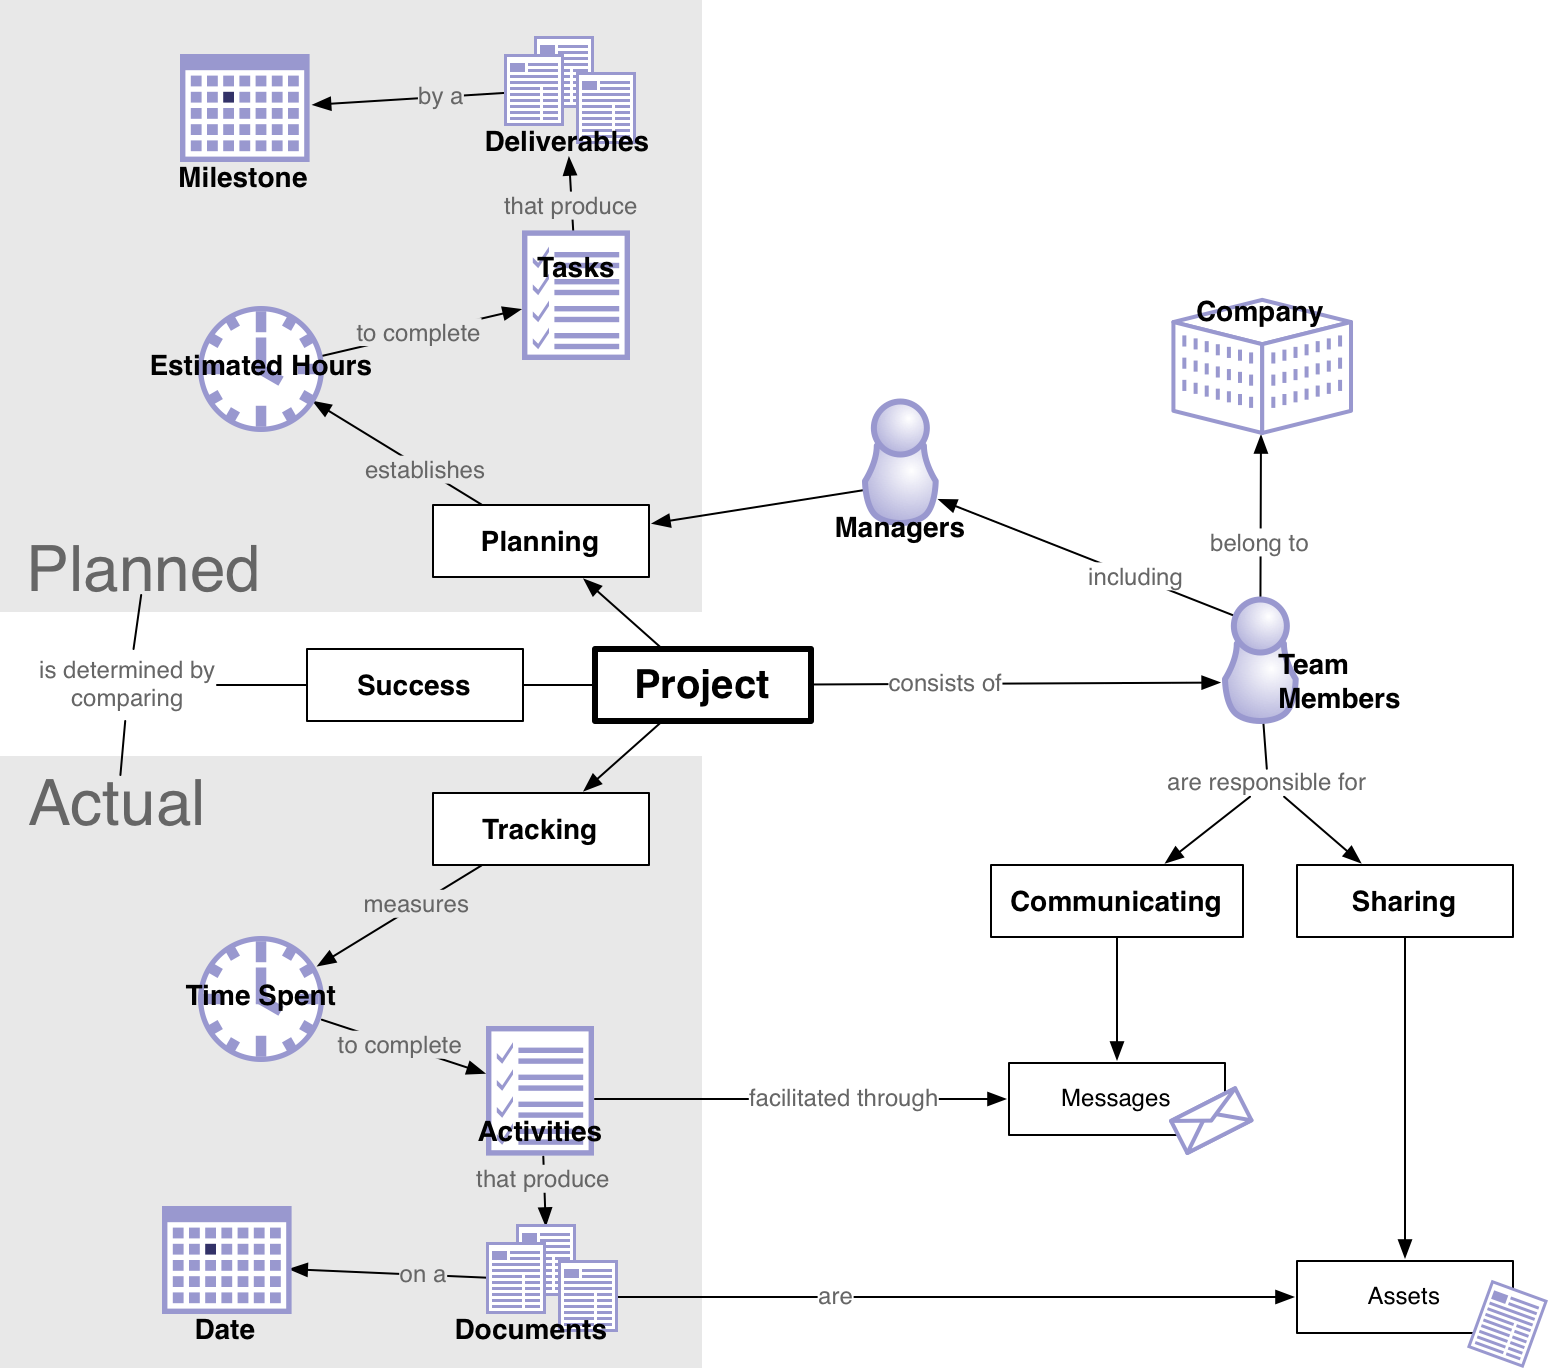
Create a conceptual model for generic project management
Put on a diagram all concepts and their relationships you think are relevant for project management
15 min
Reminder: overcoming VUCA needs
- Knowledge
- Vision (business knowledge + imagination/creativity)
- Agility
Why a KG for PM?
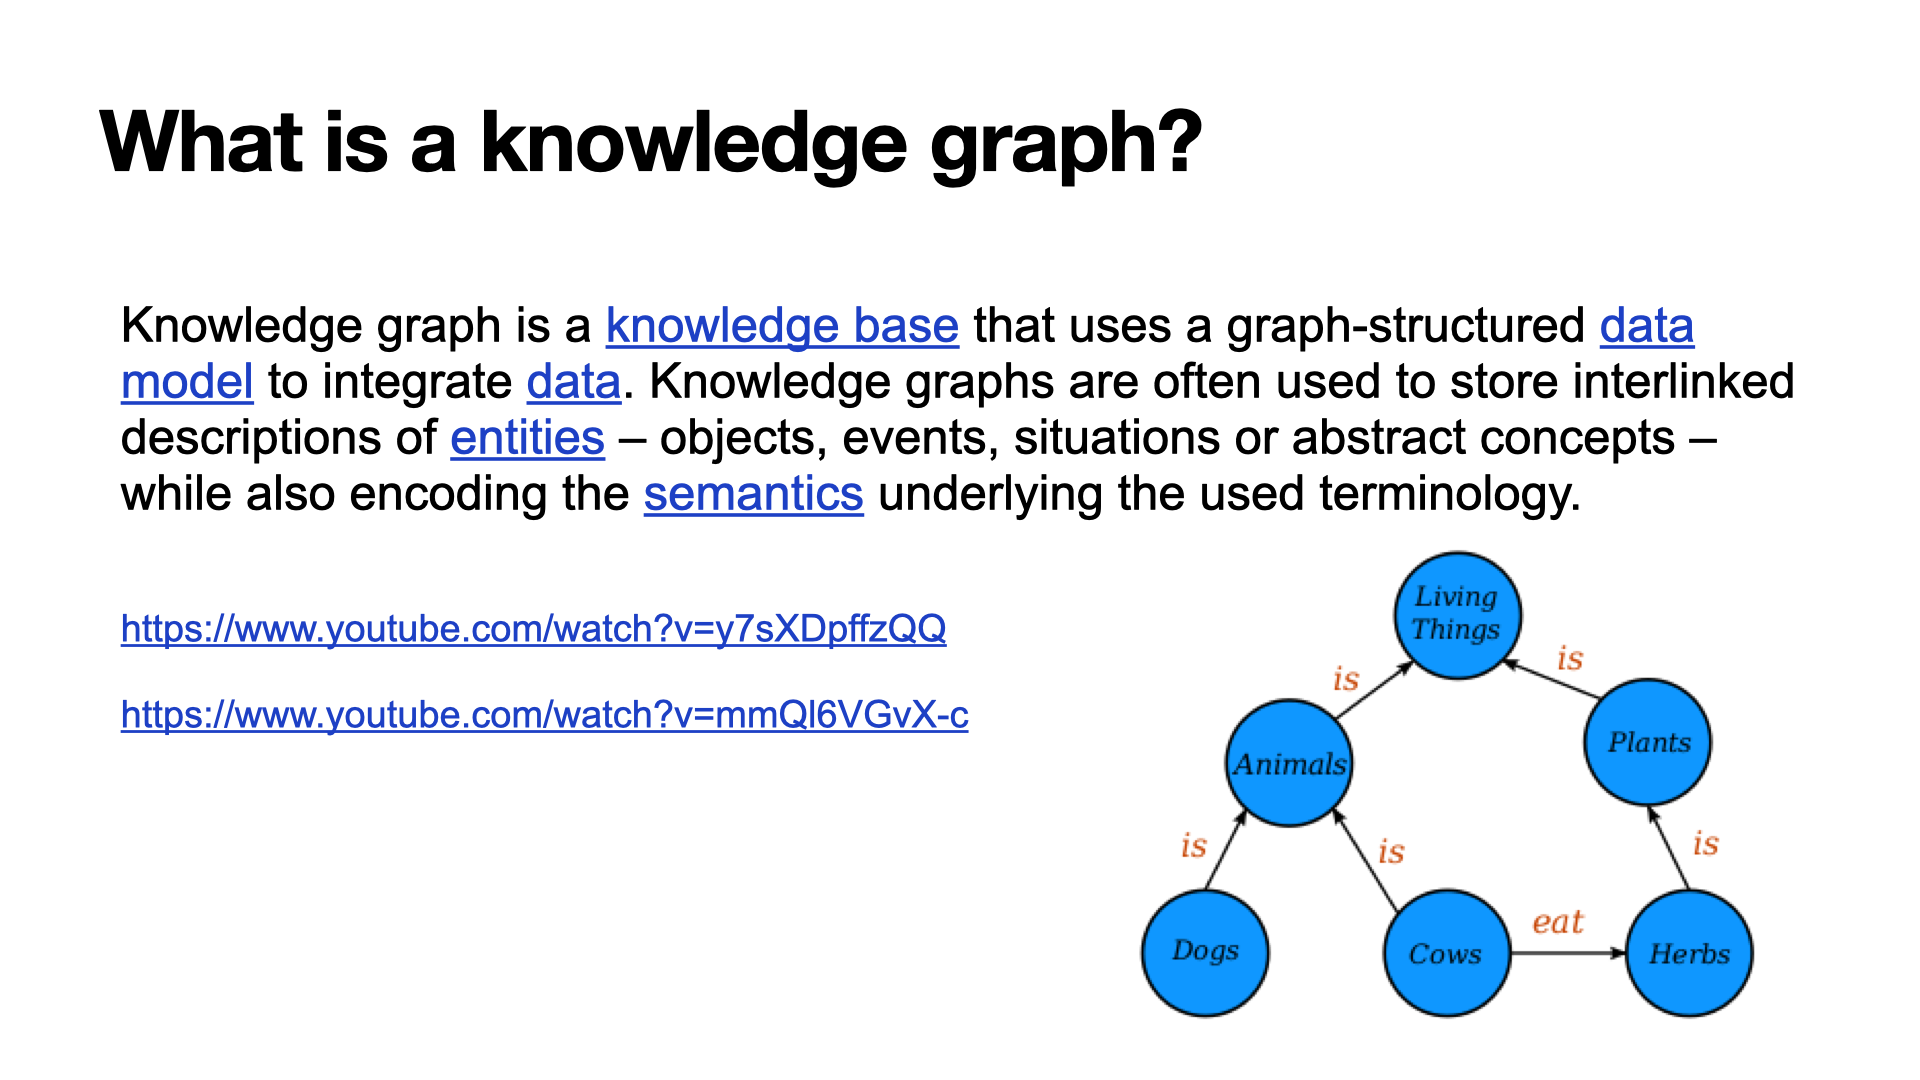
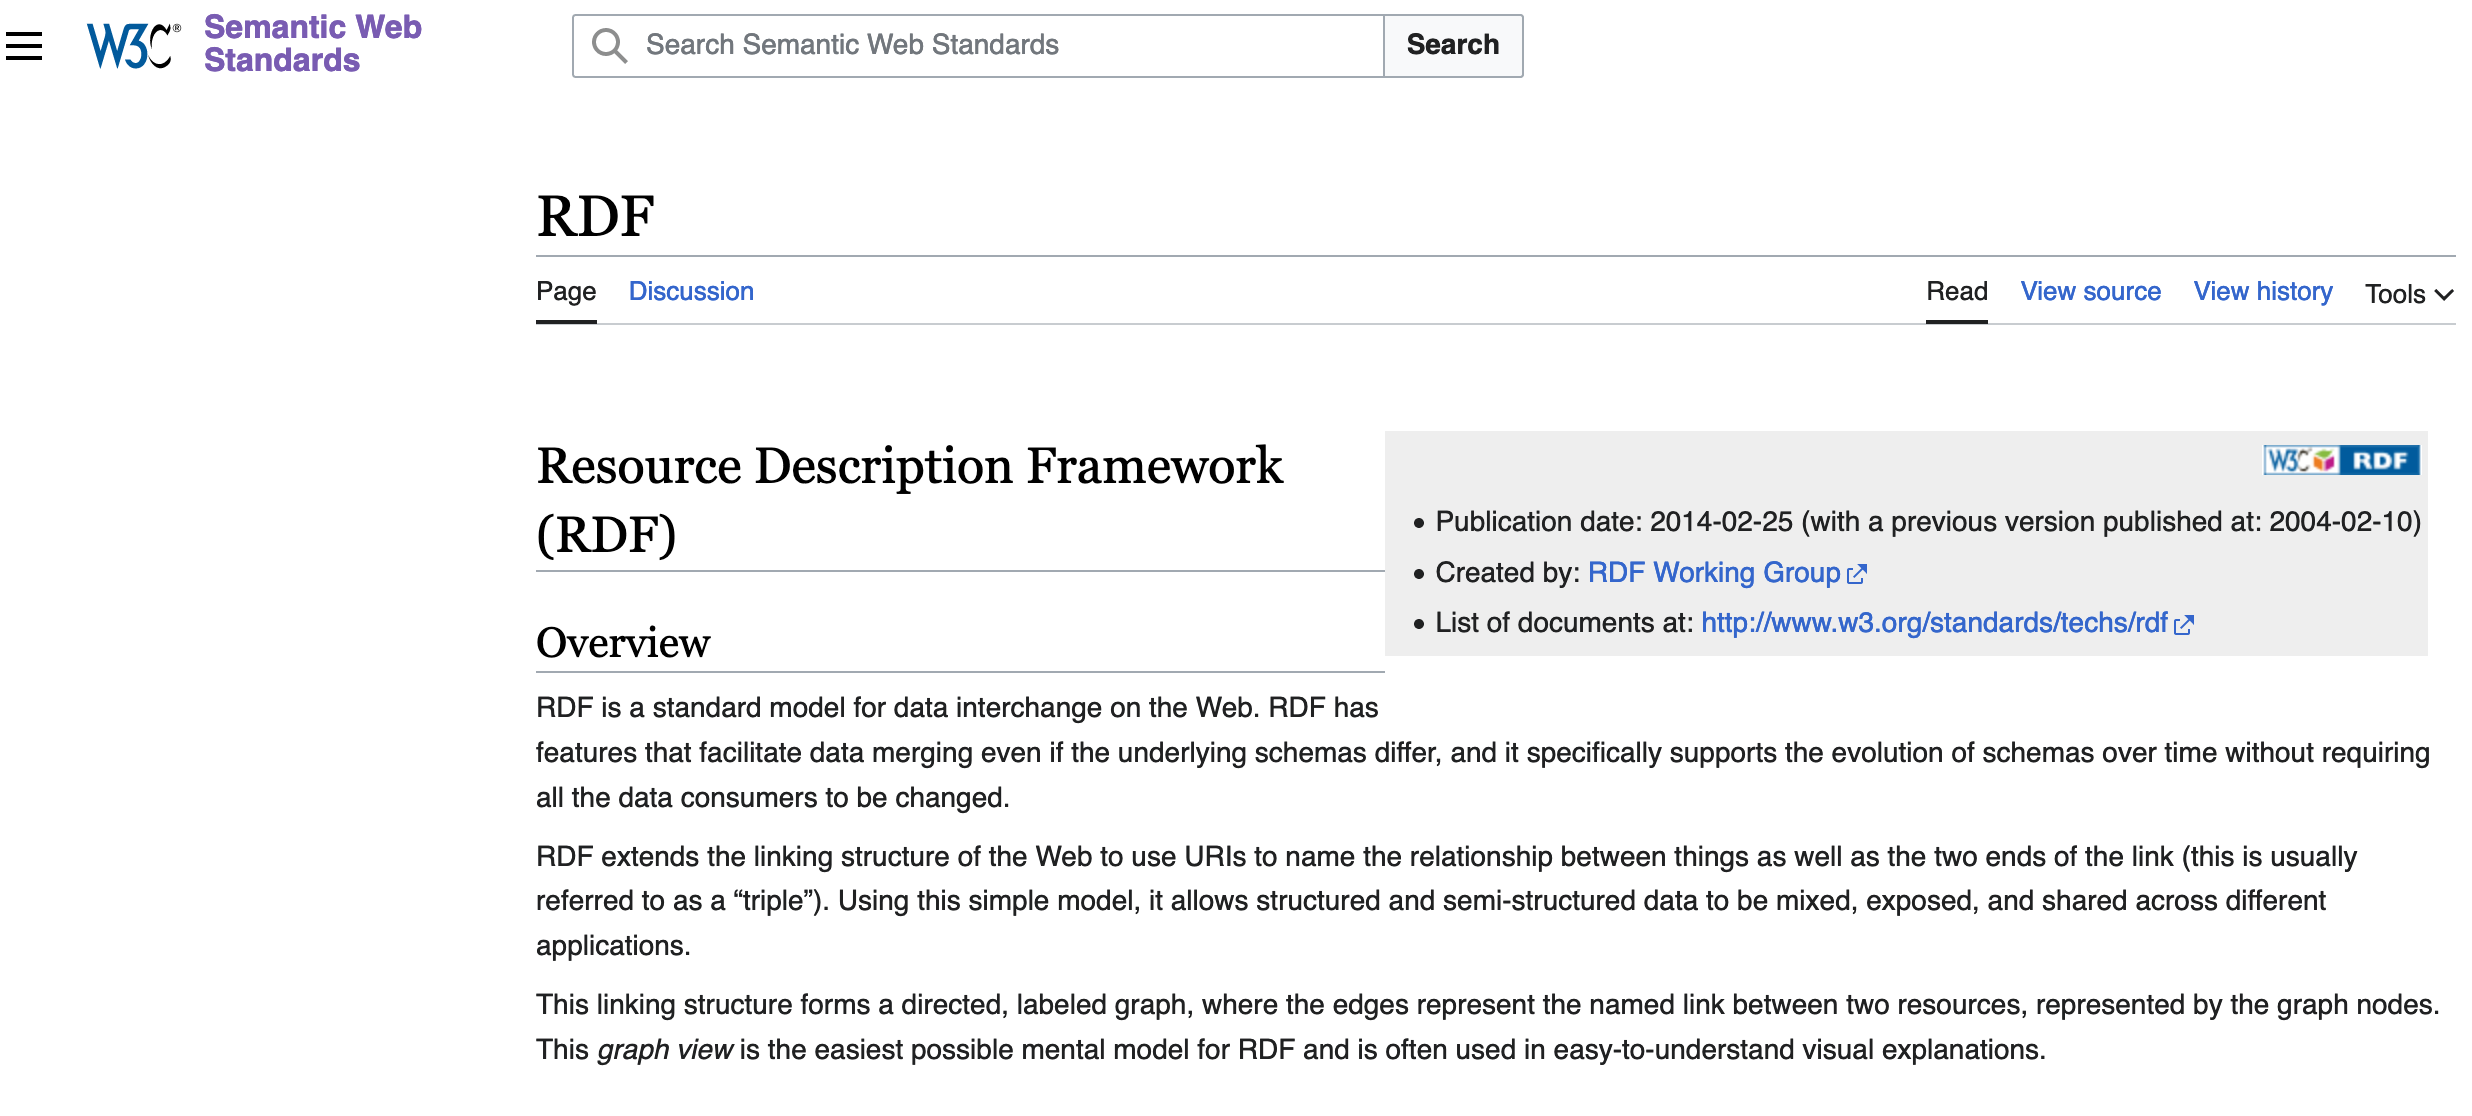
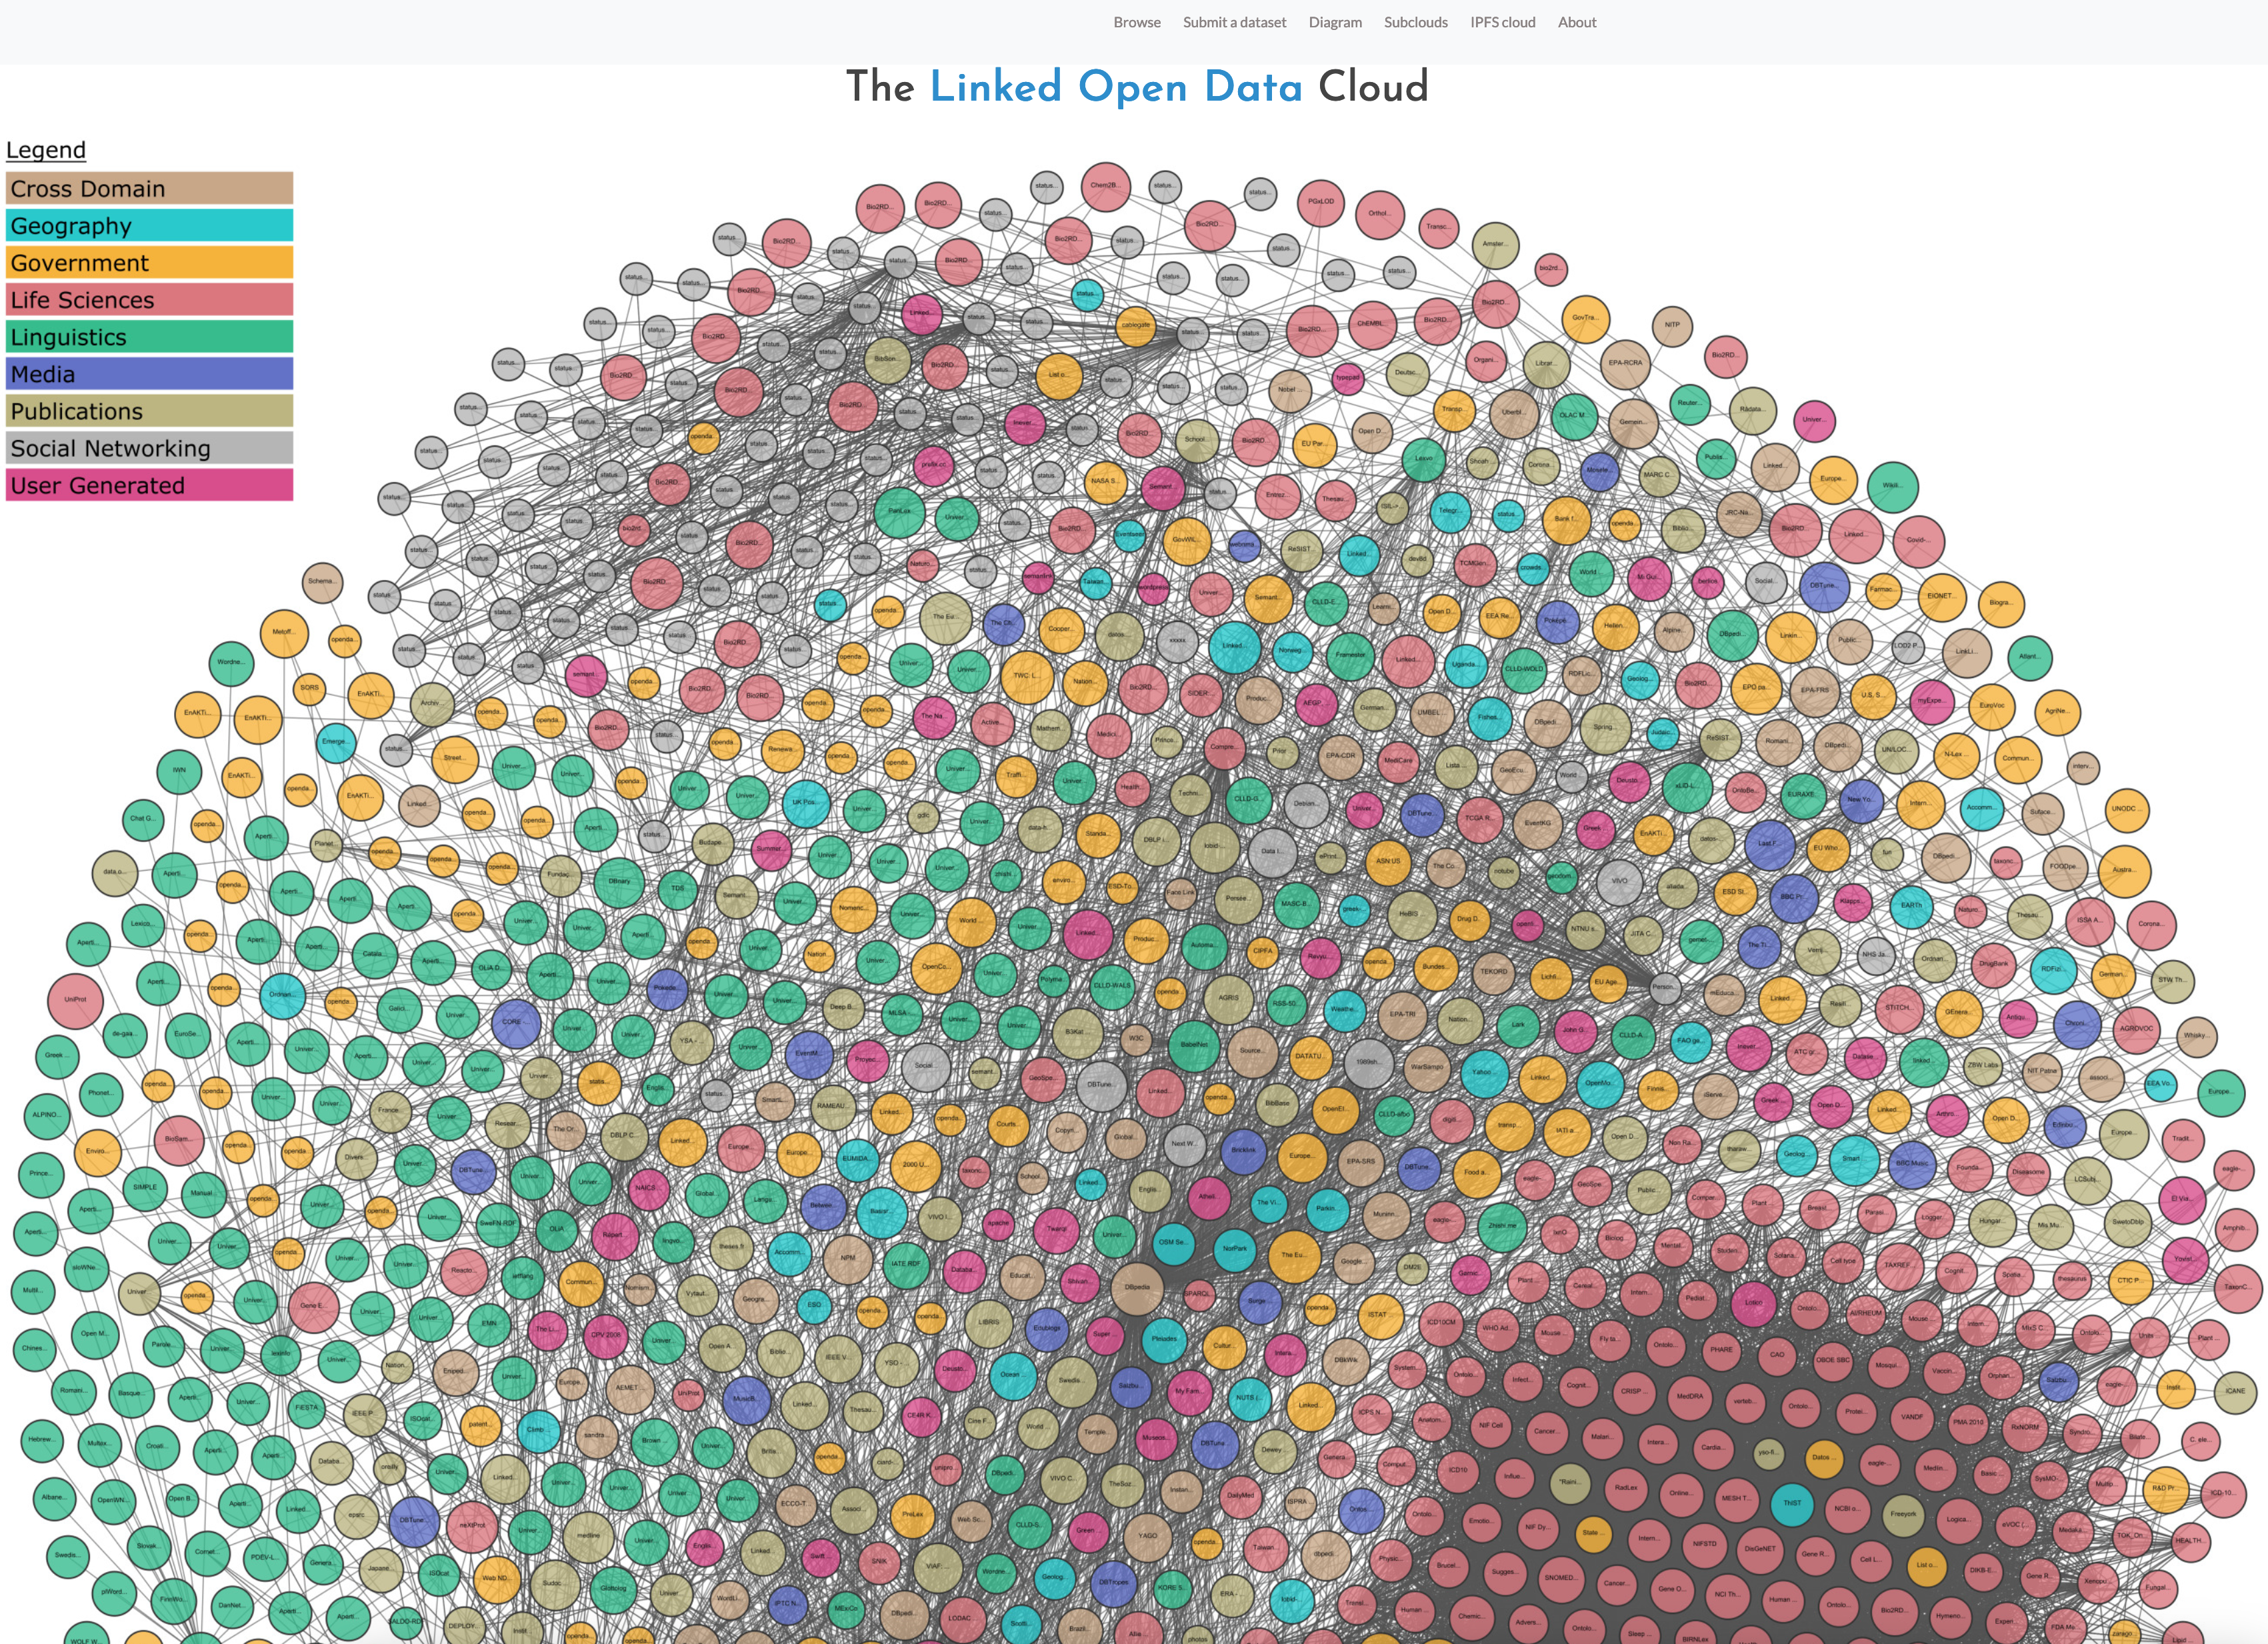
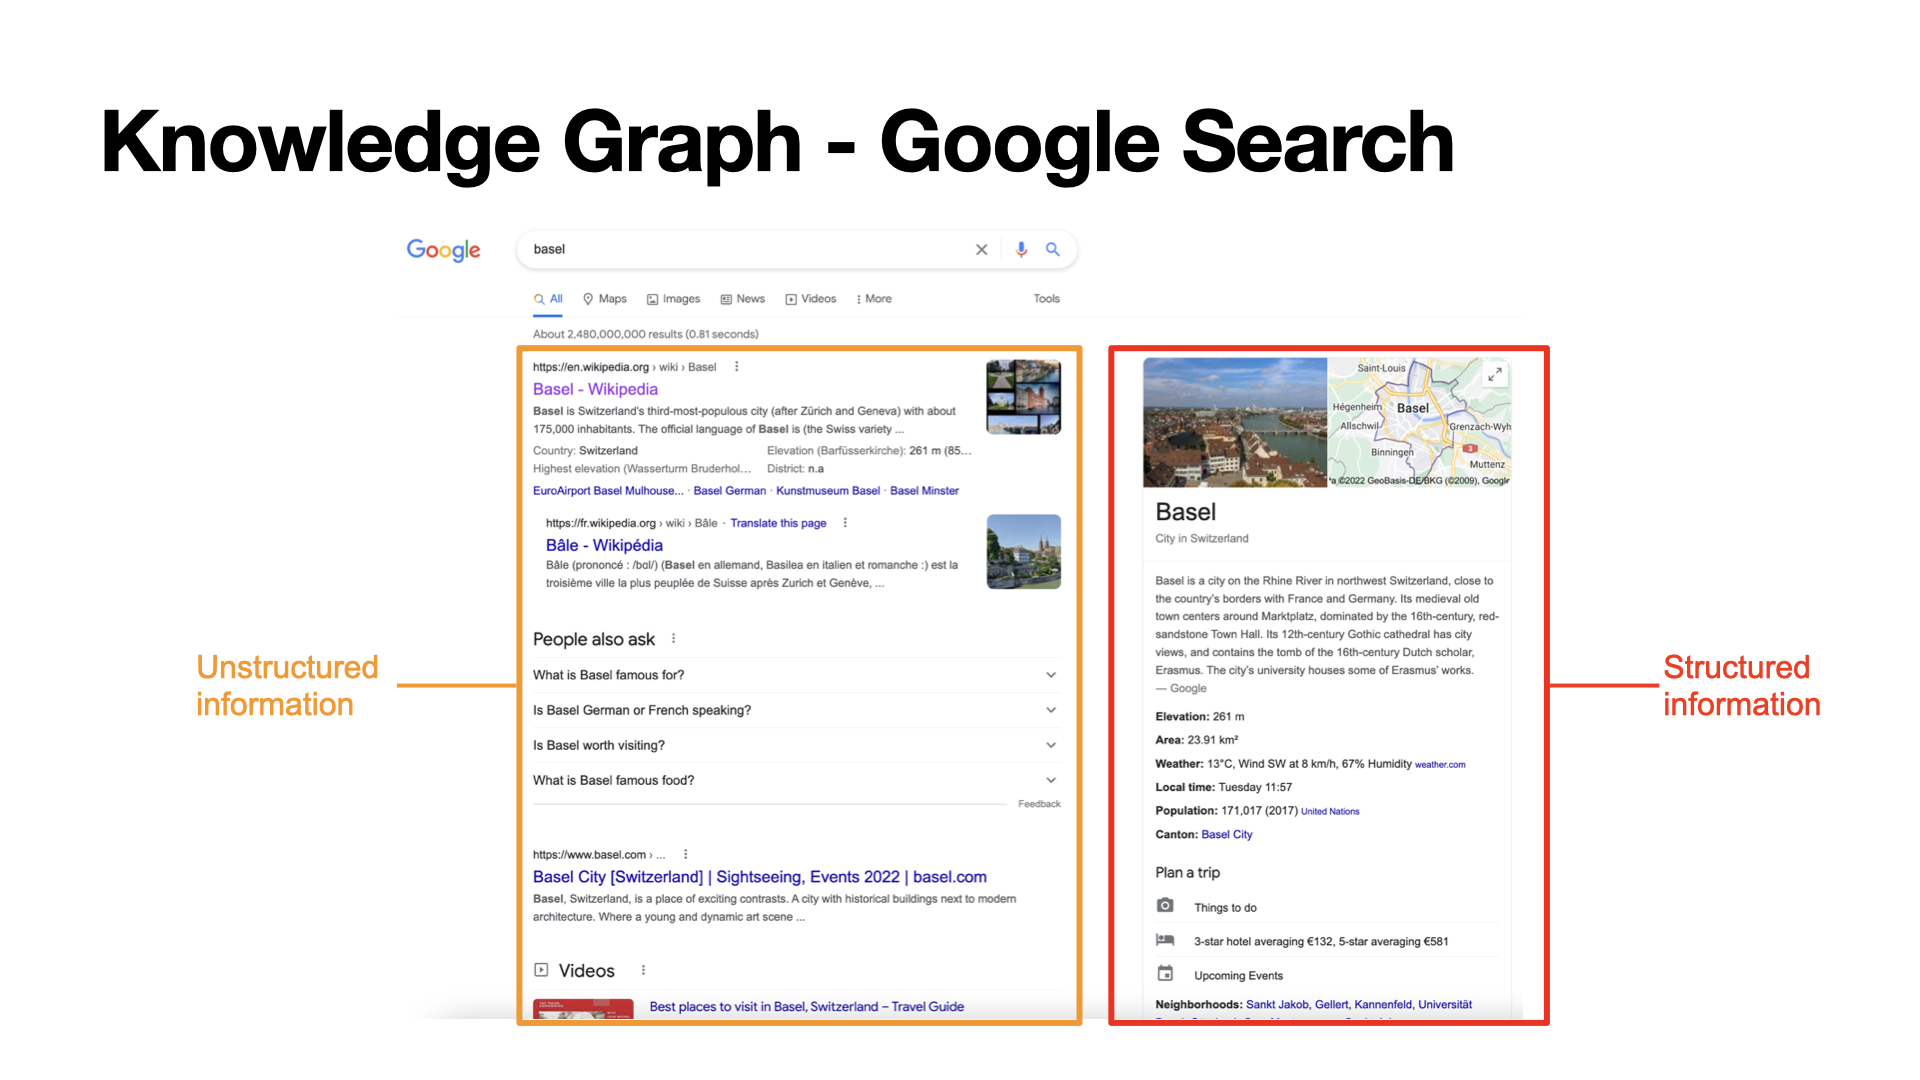
Knowledge graphs
Knowledge
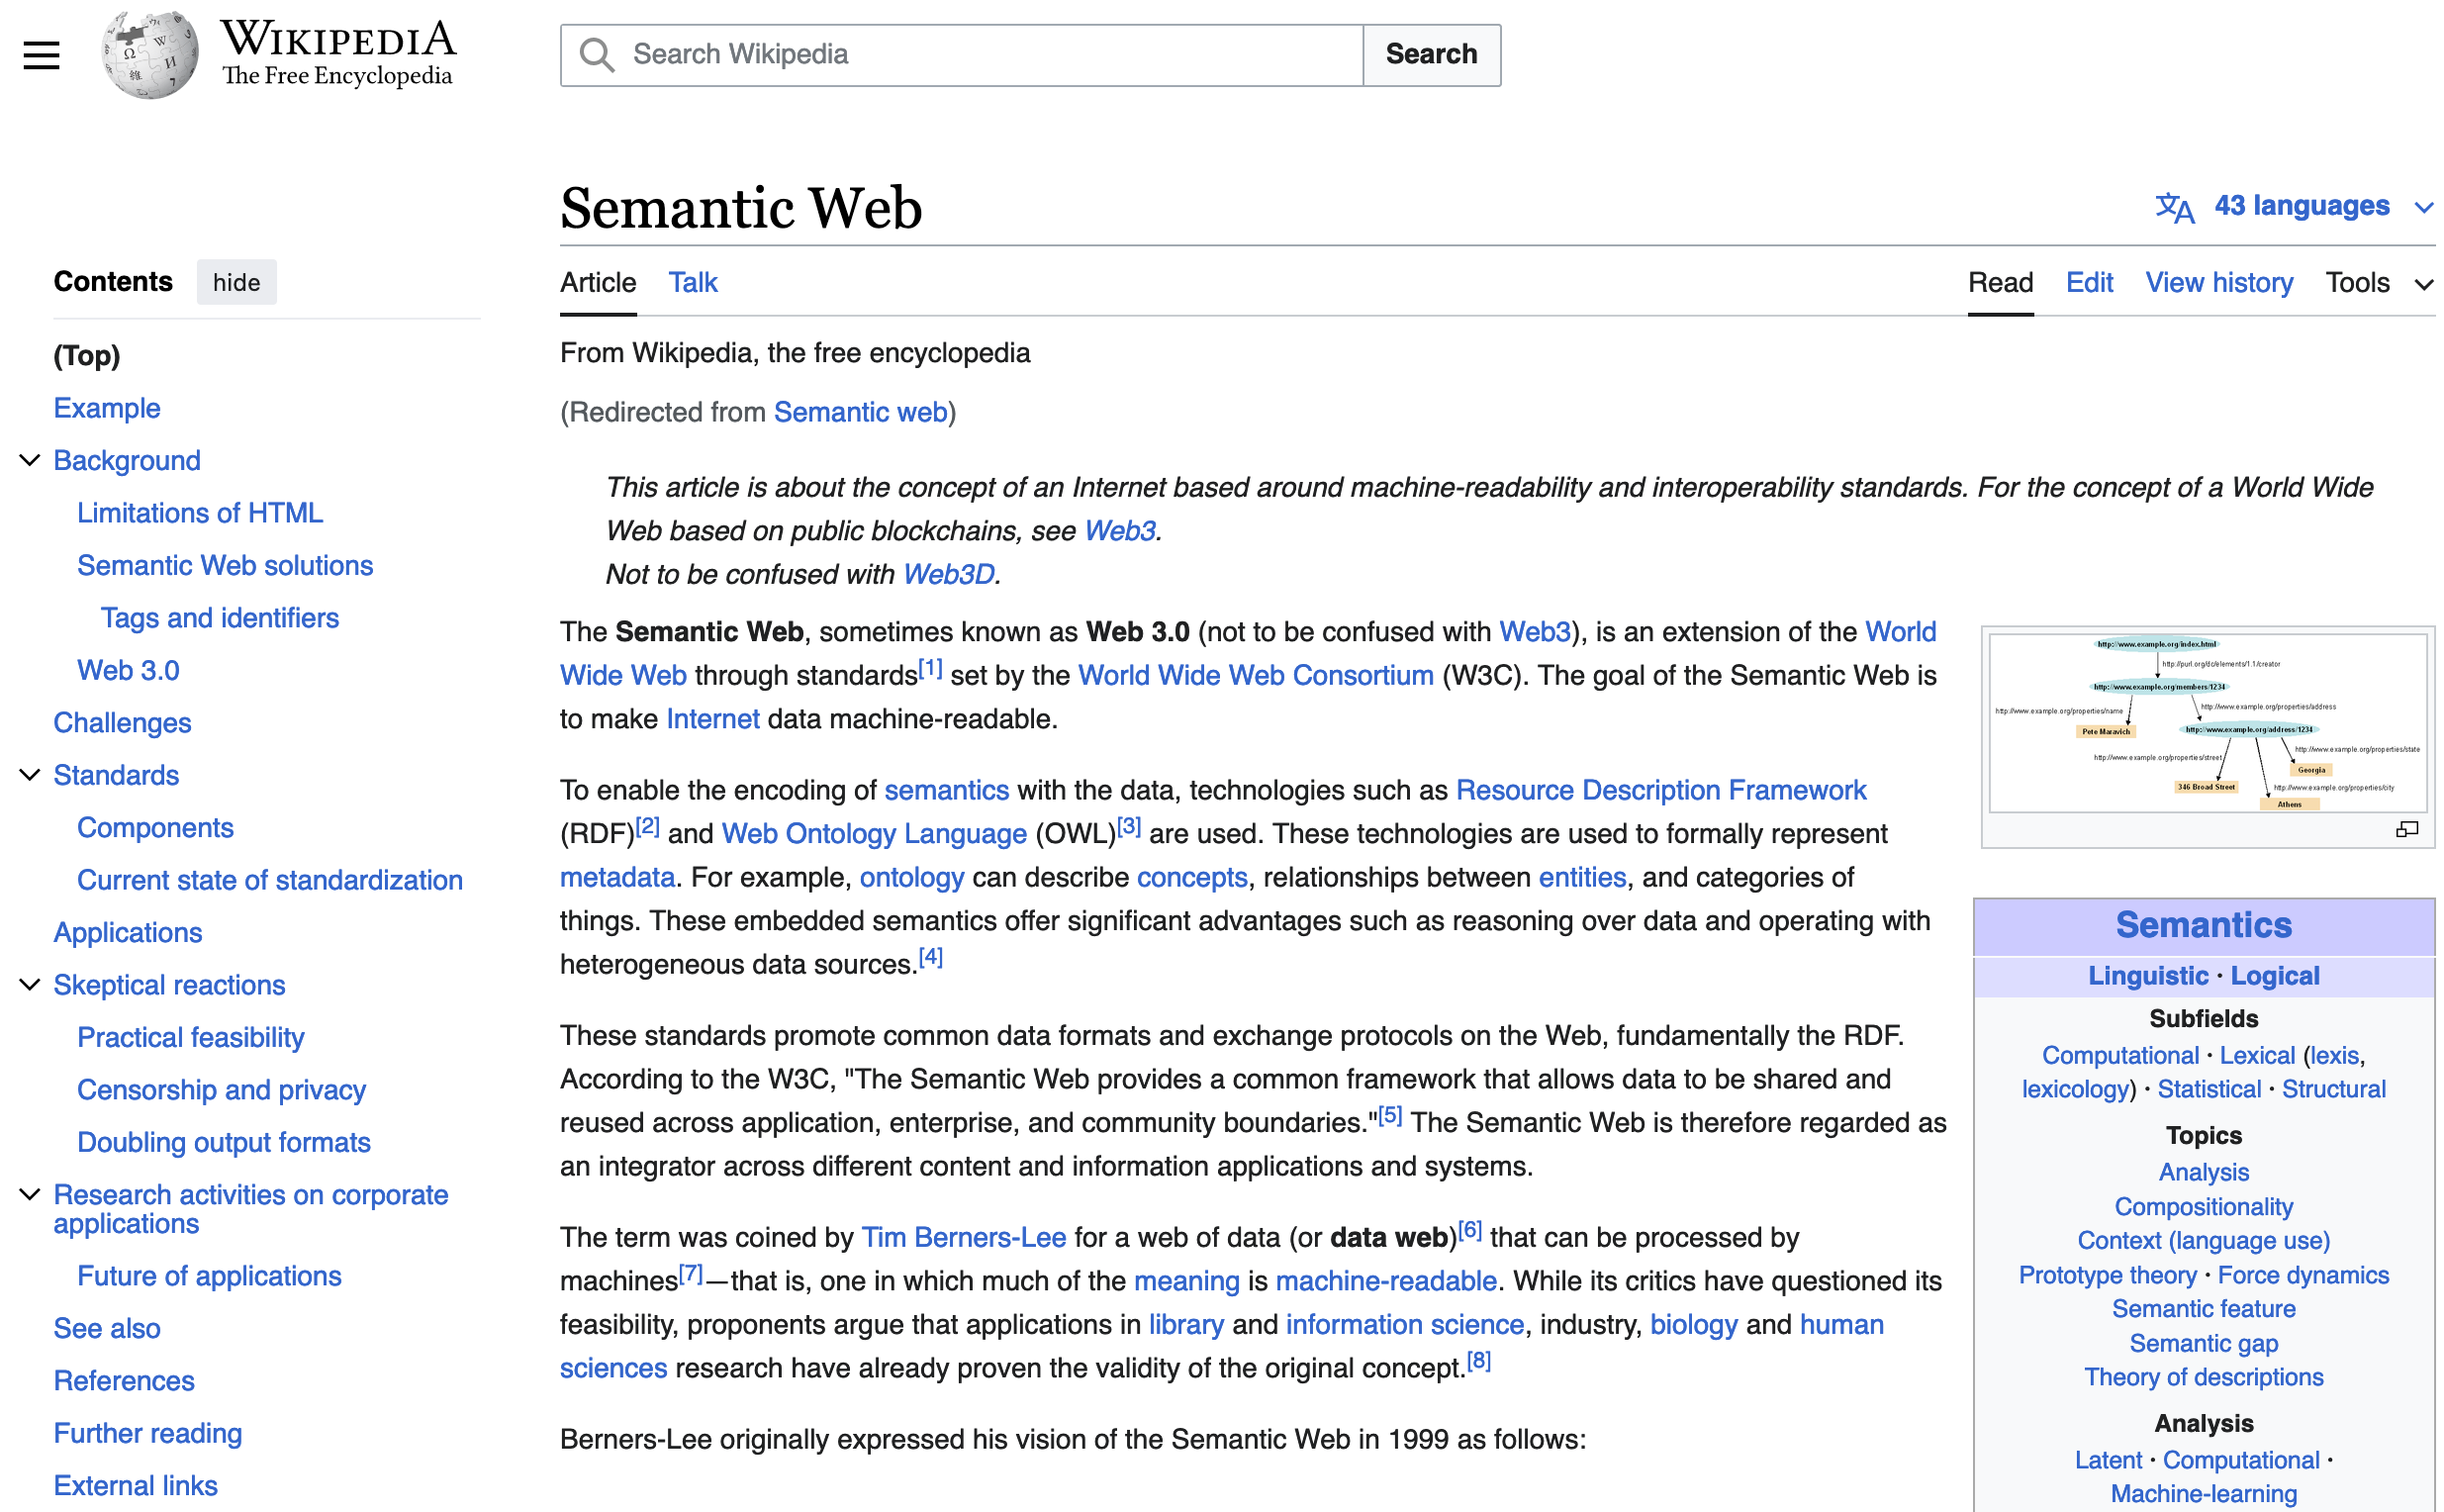
Semantic web
Get knowledge that exists nowhere else in your organization by ...
Because
- a wealth of project metadata already available and ready for reuse
- having a PM shared metamodel allows by-design to do cross-project comparison
- open standards to create metamodel: no lock-in from any

Confluence
Capability descriiption template
Dashboards
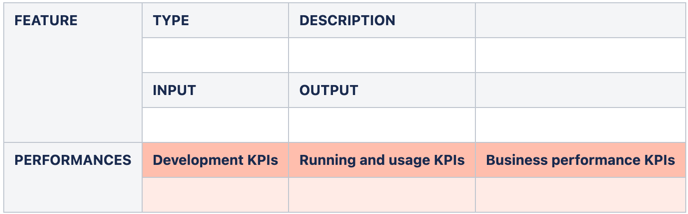
Business Performance KPIs
Usage KPIs
Development KPIs
Alias: P&LAn income statement or Profit and Loss account (also referred to as a profit and loss statement (P&L), statement of profit or loss, revenue statement, statement of financial performance, earnings statement, statement of earnings, operating statement, or statement of operations) is one of the financial statements of a company and shows the company's revenues and expenses during a particular period.It indicates how the revenues (also known as the “top line”) are transformed into the net income or net profit (the result after all revenues and expenses have been accounted for). The purpose of the income statement is to show managers and investors whether the company made money (profit) or lost money (loss) during the period being reported.
An income statement represents a period of time (as does the cash flow statement). This contrasts with the balance sheet, which represents a single moment in time.
Charitable organizations that are required to publish financial statements do not produce an income statement. Instead, they produce a similar statement that reflects funding sources compared against program expenses, administrative costs, and other operating commitments. This statement is commonly referred to as the statement of activities. Revenues and expenses are further categorized in the statement of activities by the donor restrictions on the funds received and expended.
The income statement can be prepared in one of two methods. The Single Step income statement totals revenues and subtracts expenses to find the bottom line. The Multi-Step income statement takes several steps to find the bottom line: starting with the gross profit, then calculating operating expenses. Then when deducted from the gross profit, yields income from operations.
Adding to income from operations is the difference of other revenues and other expenses. When combined with income from operations, this yields income before taxes. The final step is to deduct taxes, which finally produces the net income for the period measured.
Financial statements
Generate added value
Climat
Environmental
Pollution
Resources
Biodiversity
Raw material
Skills
- Knowledge
- Vision (business knowledge + imagination/creativity)
- Agility
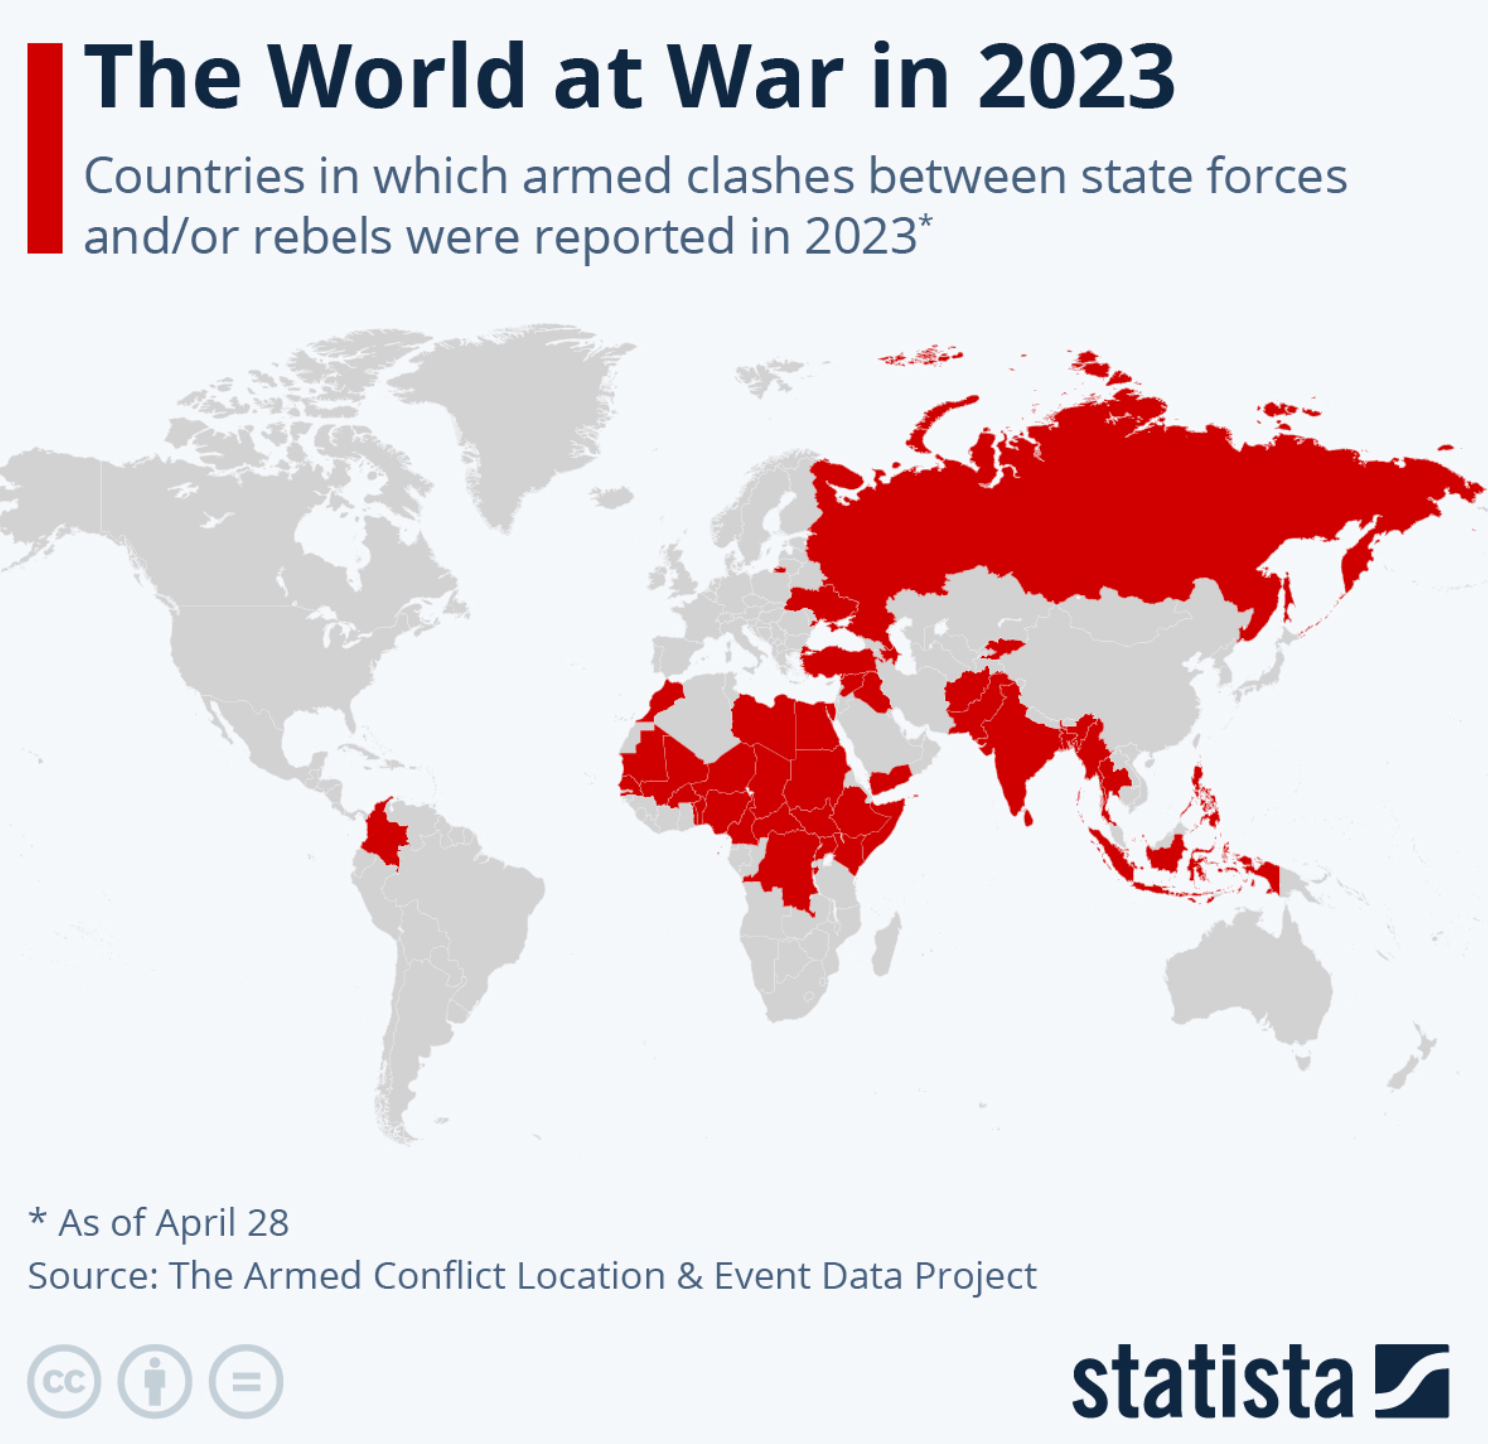
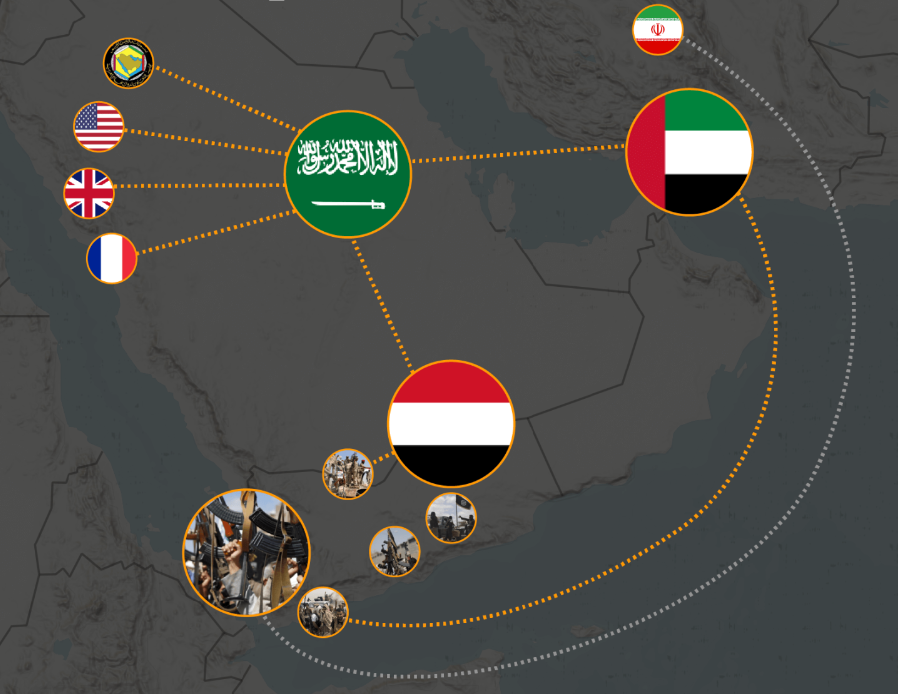
A War economy or wartime economy is the set of contingencies undertaken by a modern state to mobilize its economy for war production. Philippe Le Billon describes a war economy as a "system of producing, mobilizing and allocating resources to sustain the violence." Some measures taken include the increasing of Taylor rates as well as the introduction of resource allocation programs. Approaches to the reconfiguration of the economy differ from country to country.
Many states increase the degree of planning in their economies during wars; in many cases this extends to rationing, and in some cases to conscription for civil defenses, such as the Women's Land Army and Bevin Boys in the United Kingdom during World War II. During total war situations, certain buildings and positions are often seen as important targets by combatants. The Union blockade, Union General William Tecumseh Sherman's March to the Sea during the American Civil War, and the strategic bombing of enemy cities and factories during World War II are all examples of total war.Concerning the side of aggregate demand, the concept of a war economy has been linked to the concept of "military Keynesianism", in which the government's military budget stabilizes business cycles and fluctuations and/or is used to fight recessions. On the supply side, it has been observed that wars sometimes have the effect of accelerating technological progress to such an extent that an economy is greatly strengthened after the war, especially if it has avoided the war-related destruction. This was the case, for example, with the United States in World War I and World War II. Some economists (such as Seymour Melman) argue, however, that the wasteful nature of much of military spending eventually can hurt technological progress.
War is often used as a last ditch effort to prevent deteriorating economic conditions or currency crises, particularly by expanding services and employment in the military, and by simultaneously depopulating segments of the population to free up resources and restore the economic and social order. A temporary war economy can also be seen as a means to avoid the need for more permanent militarization. During World War II, U.S. President Franklin D. Roosevelt stated that if the Axis powers won, then "we would have to convert ourselves permanently into a militaristic power on the basis of war economy."
1. Discourse has replaced action
2. The speech is not constrained to coherence
3. Words no longer bind
4. Data/facts are often manipulated
5. Communication is often biased and misleading
6. Only thorough data investigation ensures trust

The three pillars of Project management
Scope: changes by the day; can completely change due to unexpected event; conventional risk assessment procedure does not work anymore;
SMART goals do not stand anymore (especially the Attainable, Realistic, and Time-bound)
Time: timelines are highly volatile; need for small and manageable periods (agile sprints) to adjust to change; the shorter the more stable and higher the chances to stick to it
Money: VUCA world outpaces any budgeting cycle; any budget has been outdated the moment it was submitted
Project management methodology
Command and control is slow, inefficient and does not work anymore
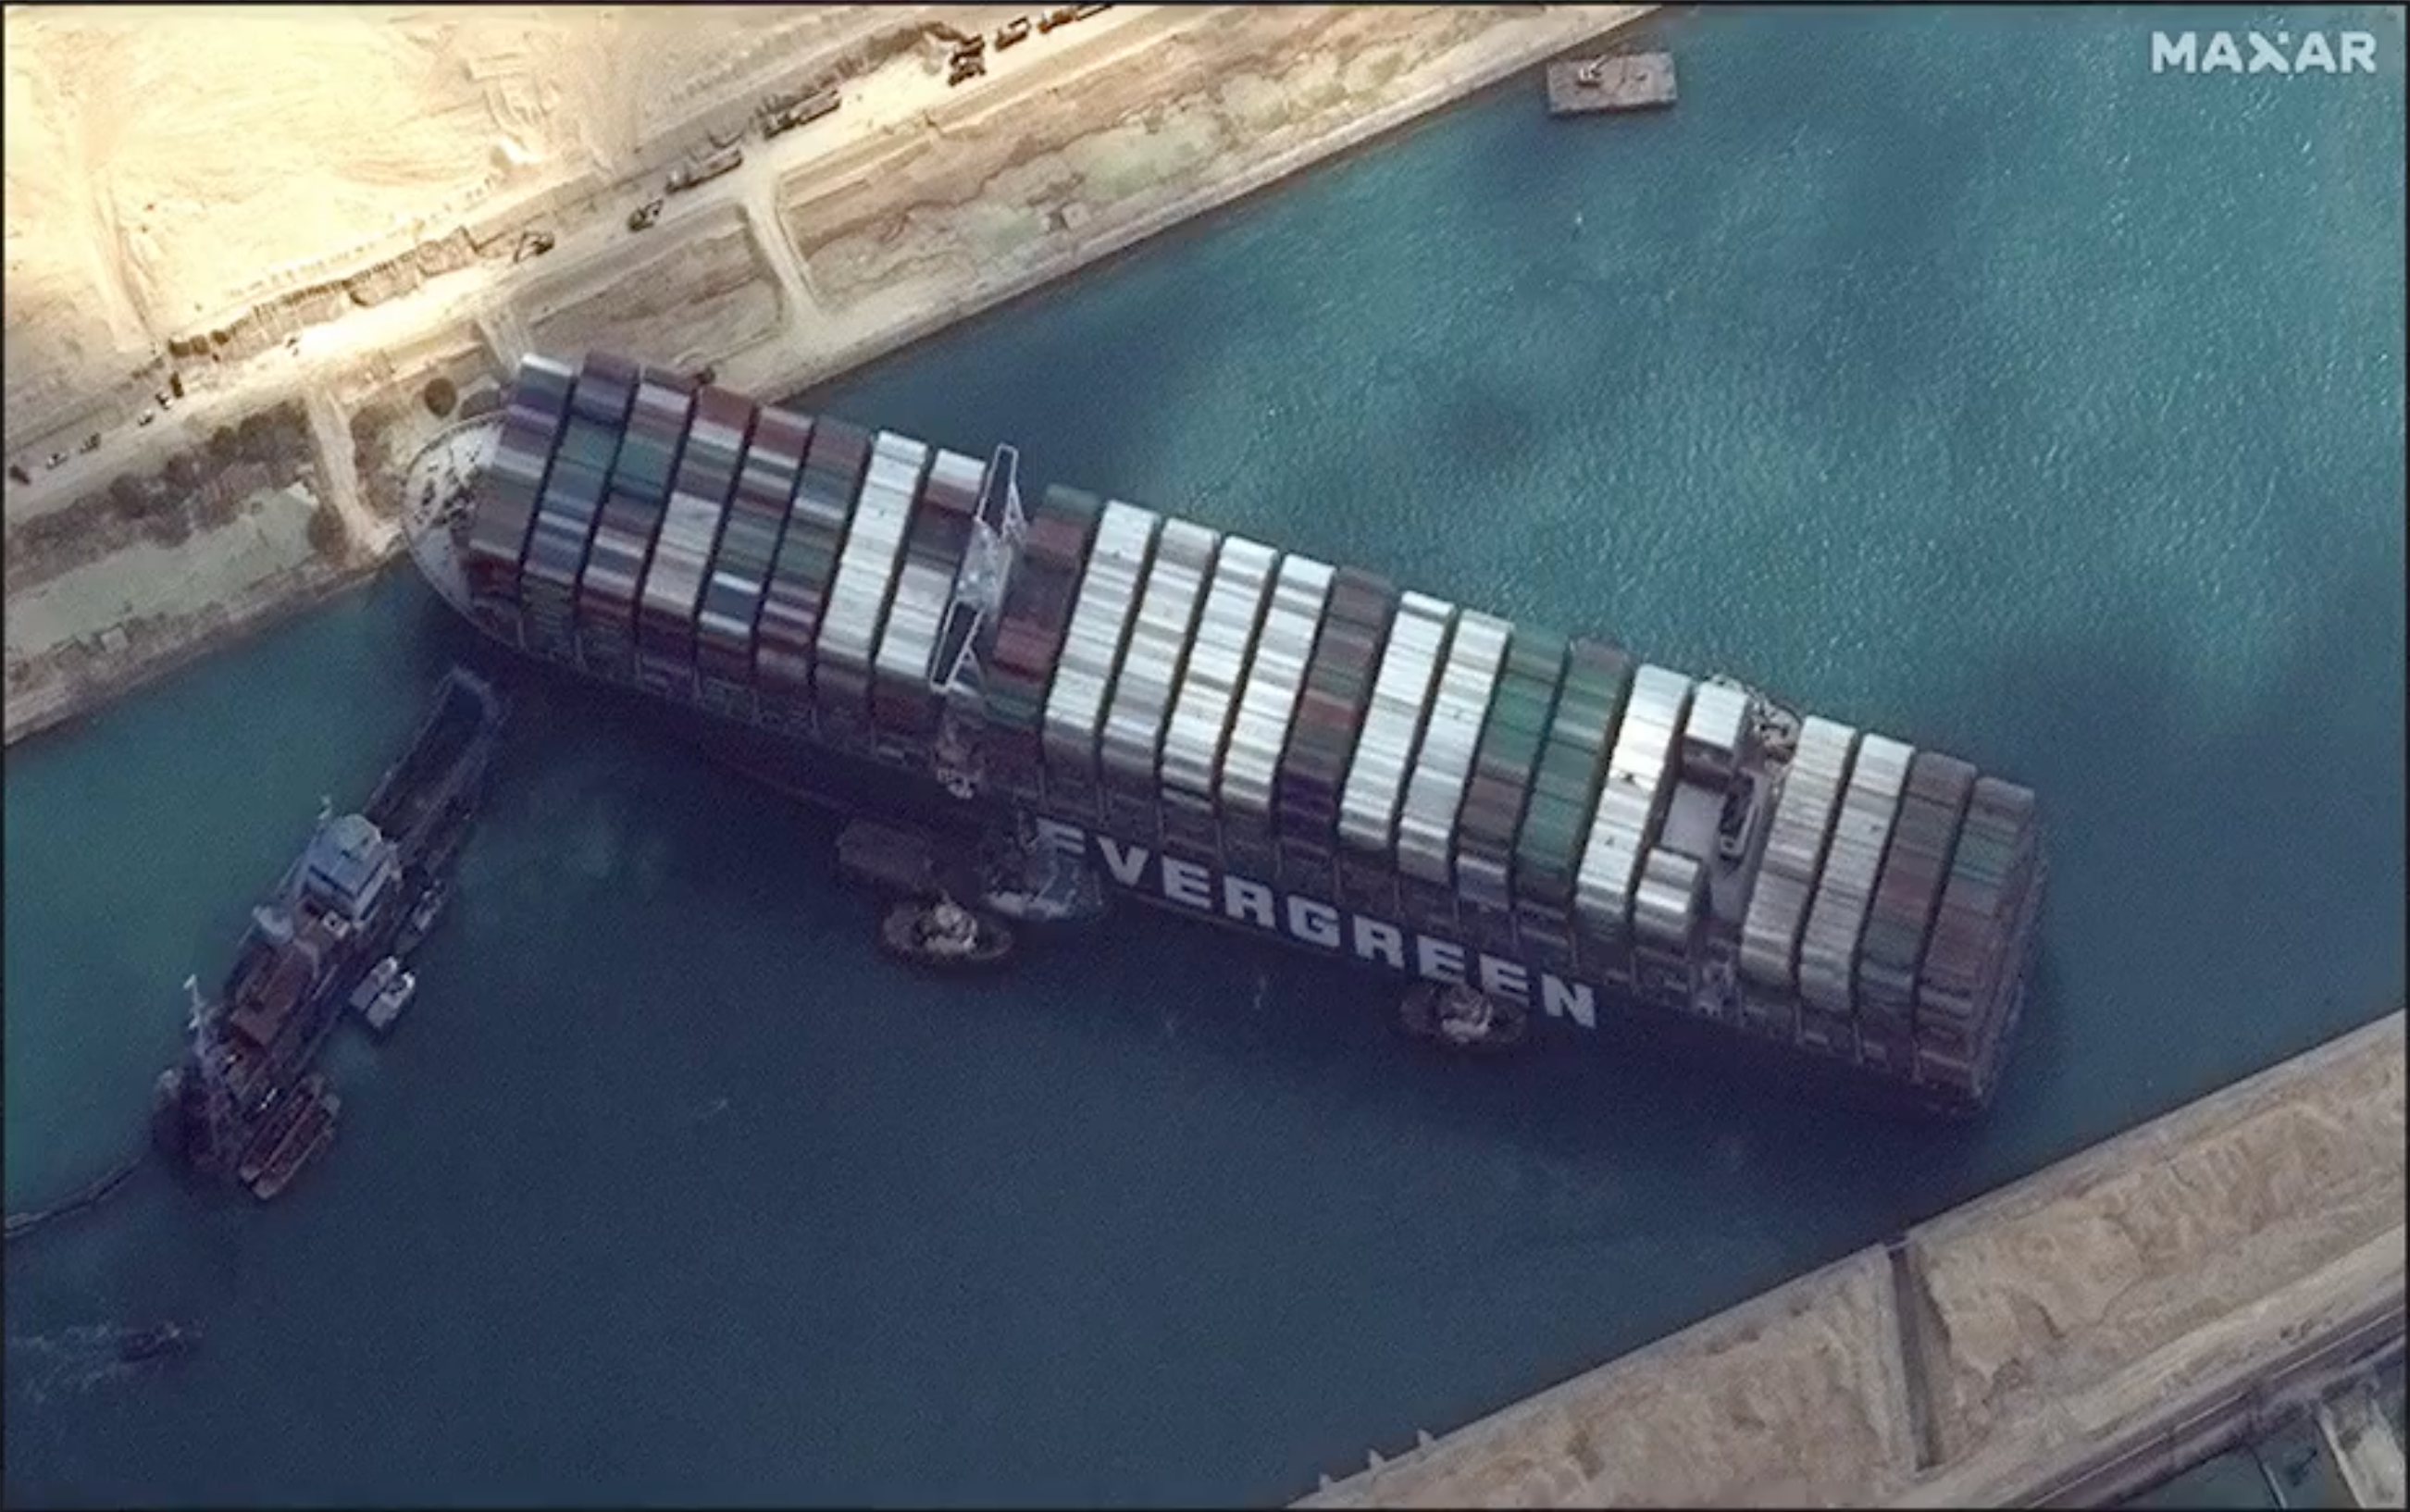
Disrupted supply chains
Source: https://en.wikipedia.org/wiki/VUCAVolatility
Drivers: changes, changes dynamics, change rate and speed, unexpected challenges, unpredictable context
Effects: risks, instability, flux, timing/duration unknown
Uncertainty
Drivers: unpredictability, potential surprises, unknown outcomes, we don't know what we don't know, what we don't know increases
Effects: lake of direction, no risk taking, paralysis preventing action
Complexity
Drivers: overwhelming amount of information (big data Vs), tasks correlation, multifaceted effects, influencers, interdependencies,
Effects: unproductively, dilemas, inability to stand for CONs of any decision
Ambiguity
Drivers: ideal vs. actual, many stakeholders, contradictory inputs, diverging interests/opinions, causal relationships are unclear, no precedents
Effects: doubt, distrust, lapses in decision-making, hurt innovation
How to mitigate VUCA?
- Volatility: need for a clear vision, take actions, probe changes, react quickly
- Uncertainty: collect enough knowledge, have a wide understanding, different perspectives, cope with complexity
- Complexity: simplification, creativity, clear focus, flexibility, clarity
- Ambiguity: agility, decision-making, fast prototyping, innovation
Every year, approximately $48 trillion are invested in projects. Yet according to the Standish Group in 2015, only 35% of projects are considered successful. The wasted resources and unrealised benefits of the other 65% are mind-blowing.
How will this evolve in the current VUCA environment?
How will it evolve with human knowledge being diluted by machine-generated artefacts ChatGPT
Source: https://hbr.org/2023/02/how-ai-will-transform-project-managementVision: Sometime in the near future, the CEO of a large telecom provider is using a smartphone app to check on her organization’s seven strategic initiatives. Within a few taps, she knows the status of every project and what percentage of expected benefits each one has delivered. Project charters and key performance indicators are available in moments, as are each team member’s morale level and the overall buy-in of critical stakeholders.
PM role of the future: spends most of his time coaching and supporting the team, maintaining regular conversations with key stakeholders, and cultivating a high-performing culture.
Every year, approximately $48 trillion are invested in projects. Yet according to the Standish Group, only 35% of projects are considered successful. The wasted resources and unrealised benefits of the other 65% are mind-blowing.
Lack of adequate PM tech
One reason we have found why project success rates are so poor is the low level of maturity of technologies available for managing them. Most organizations and project leaders are still using spreadsheets, slides, and other applications that haven’t evolved much over the past few decades. These are adequate when you are measuring project success by deliverables and deadlines met, but they fall short in an environment where projects and initiatives are always adapting — and continuously changing the business. There has been improvement in project portfolio management applications, but planning and team collaboration capabilities, automation and “intelligent” features are still lacking.
Gartner’s research indicates that change is coming soon, predicting that by 2030, 80% of project management tasks will be run by AI, powered by big data, machine learning (ML), and natural language processing.
Aspects of PM that will be disrupted
- Better selection and prioritization
- Support for the project management office
- Improved, faster project definition, planning, and reporting
- Virtual project assistants
- Advanced testing systems and software
- A new role for the project manager
- I'm present in all classrooms of the world
- I'm helping you to explain complex stuff
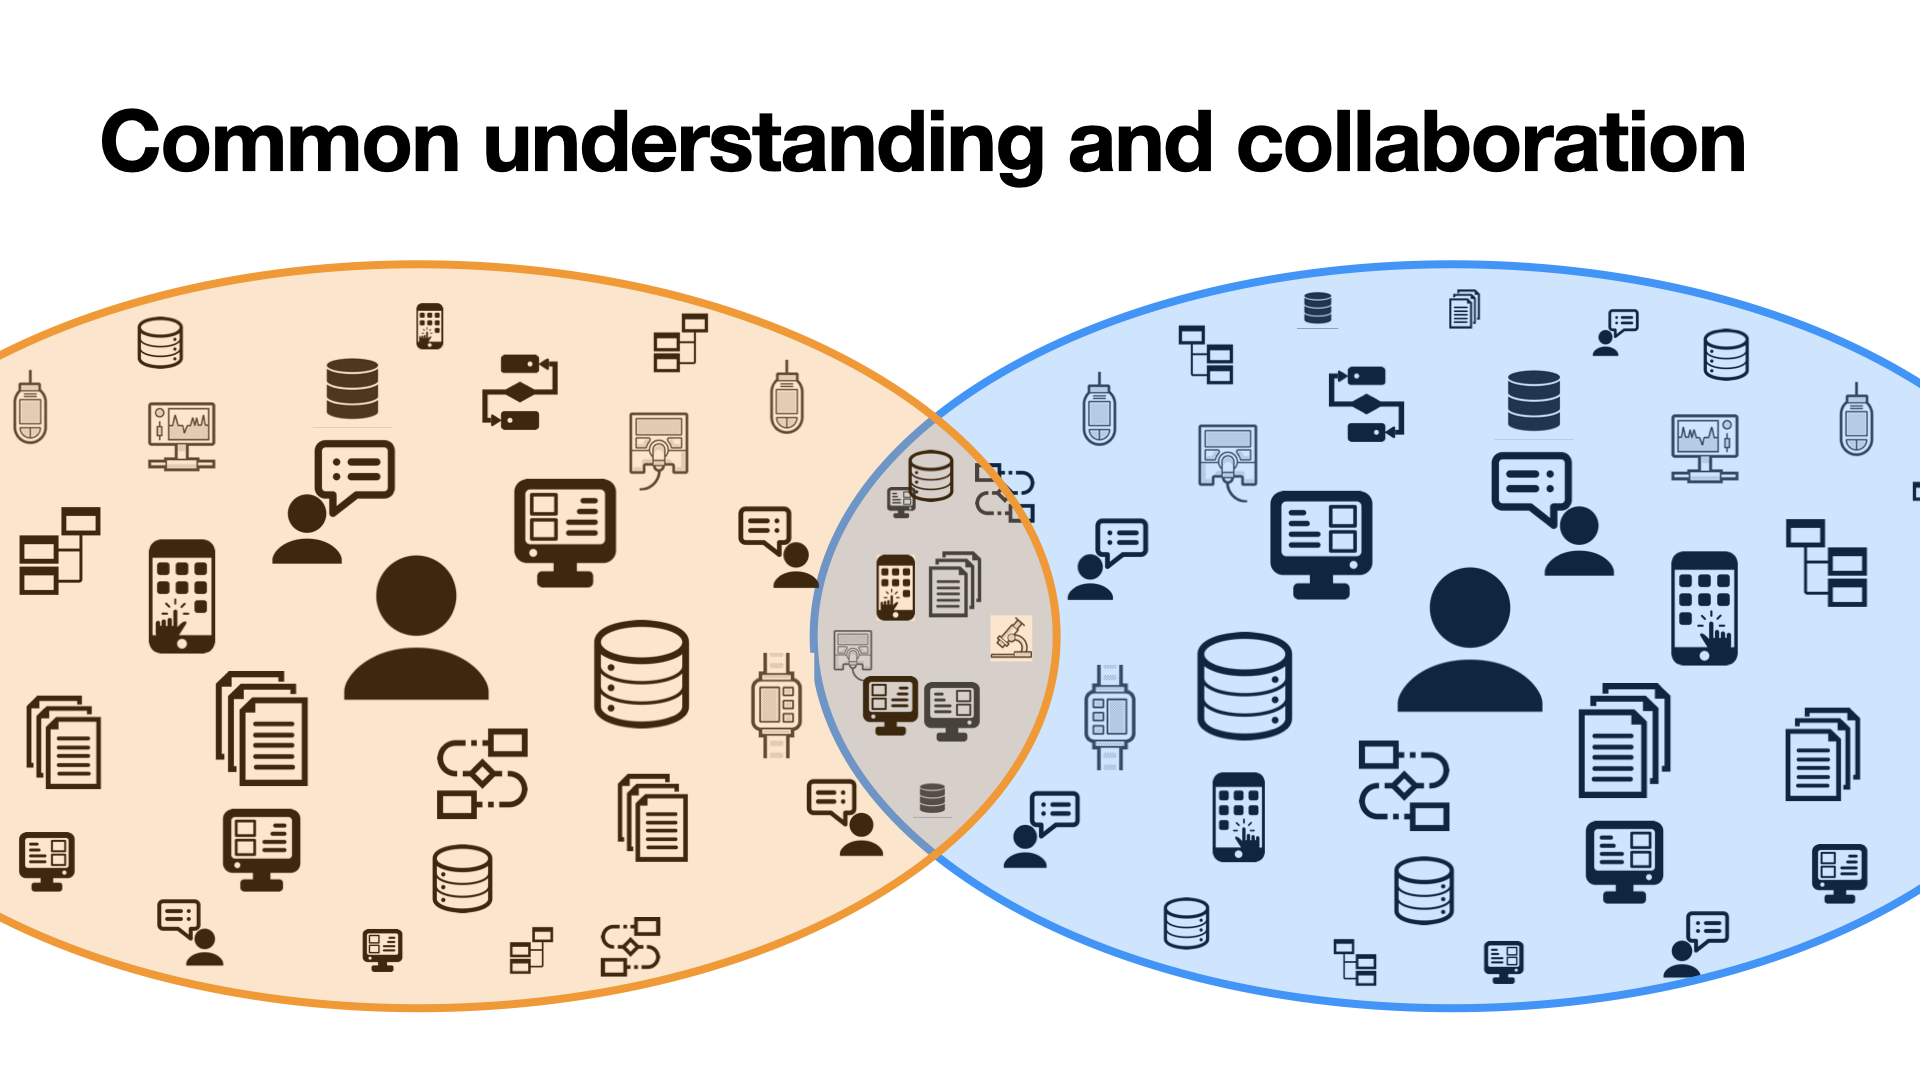
- I'm a support to create common understandings

Decomposition
- Based on "Divide to better rule"
- It is essential to decompose a complex system into smaller and smaller parts, each of which we may then refine independently
- understand any given level of a system, we need only comprehend a few parts (rather than all parts) at once
1) Algorithmic Decomposition
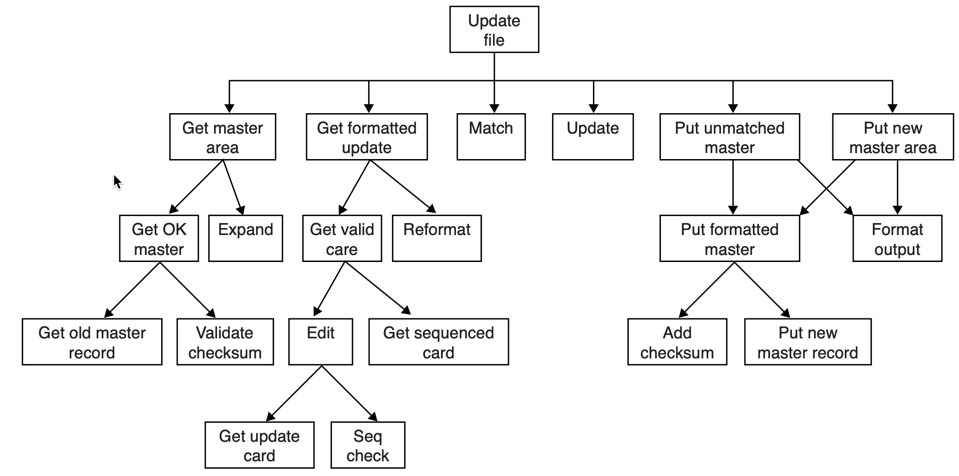
2) Object-oriented decomposition

What are you doing when discussing a new project, a new problem?


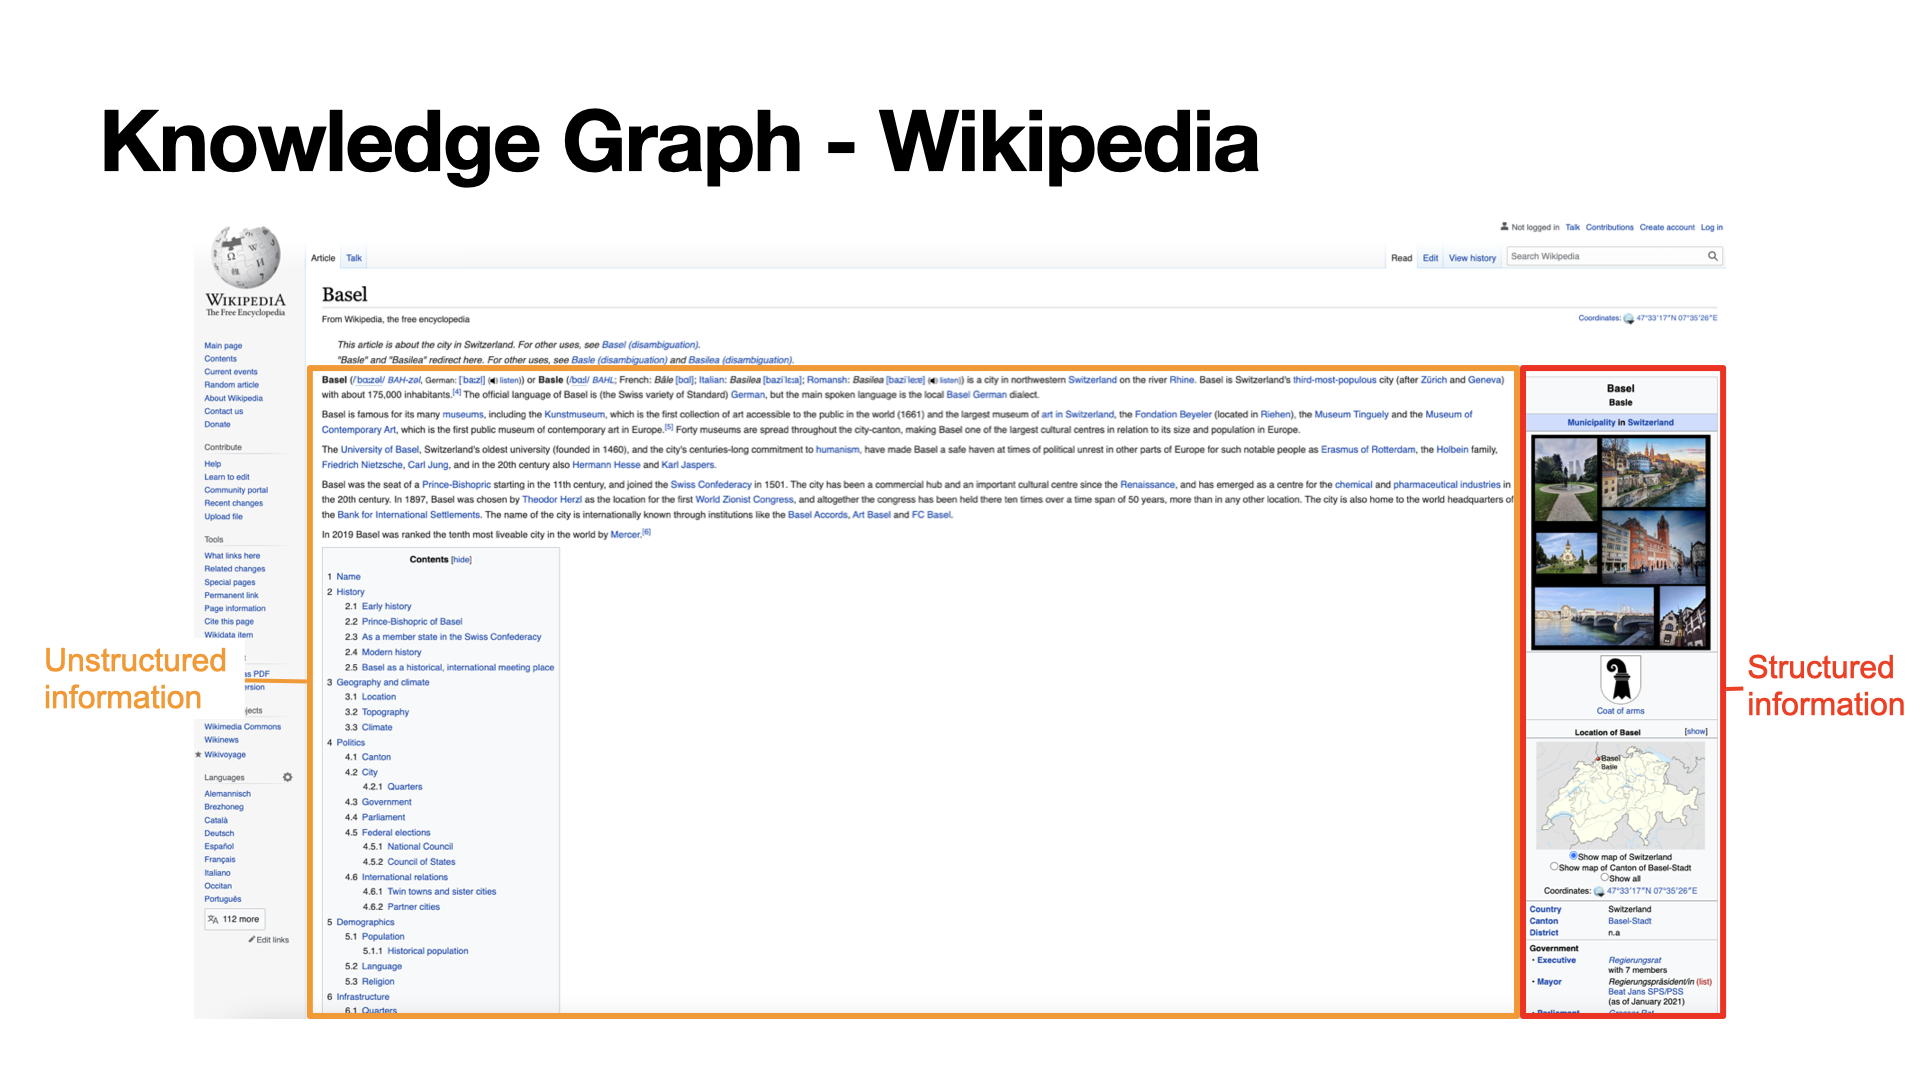
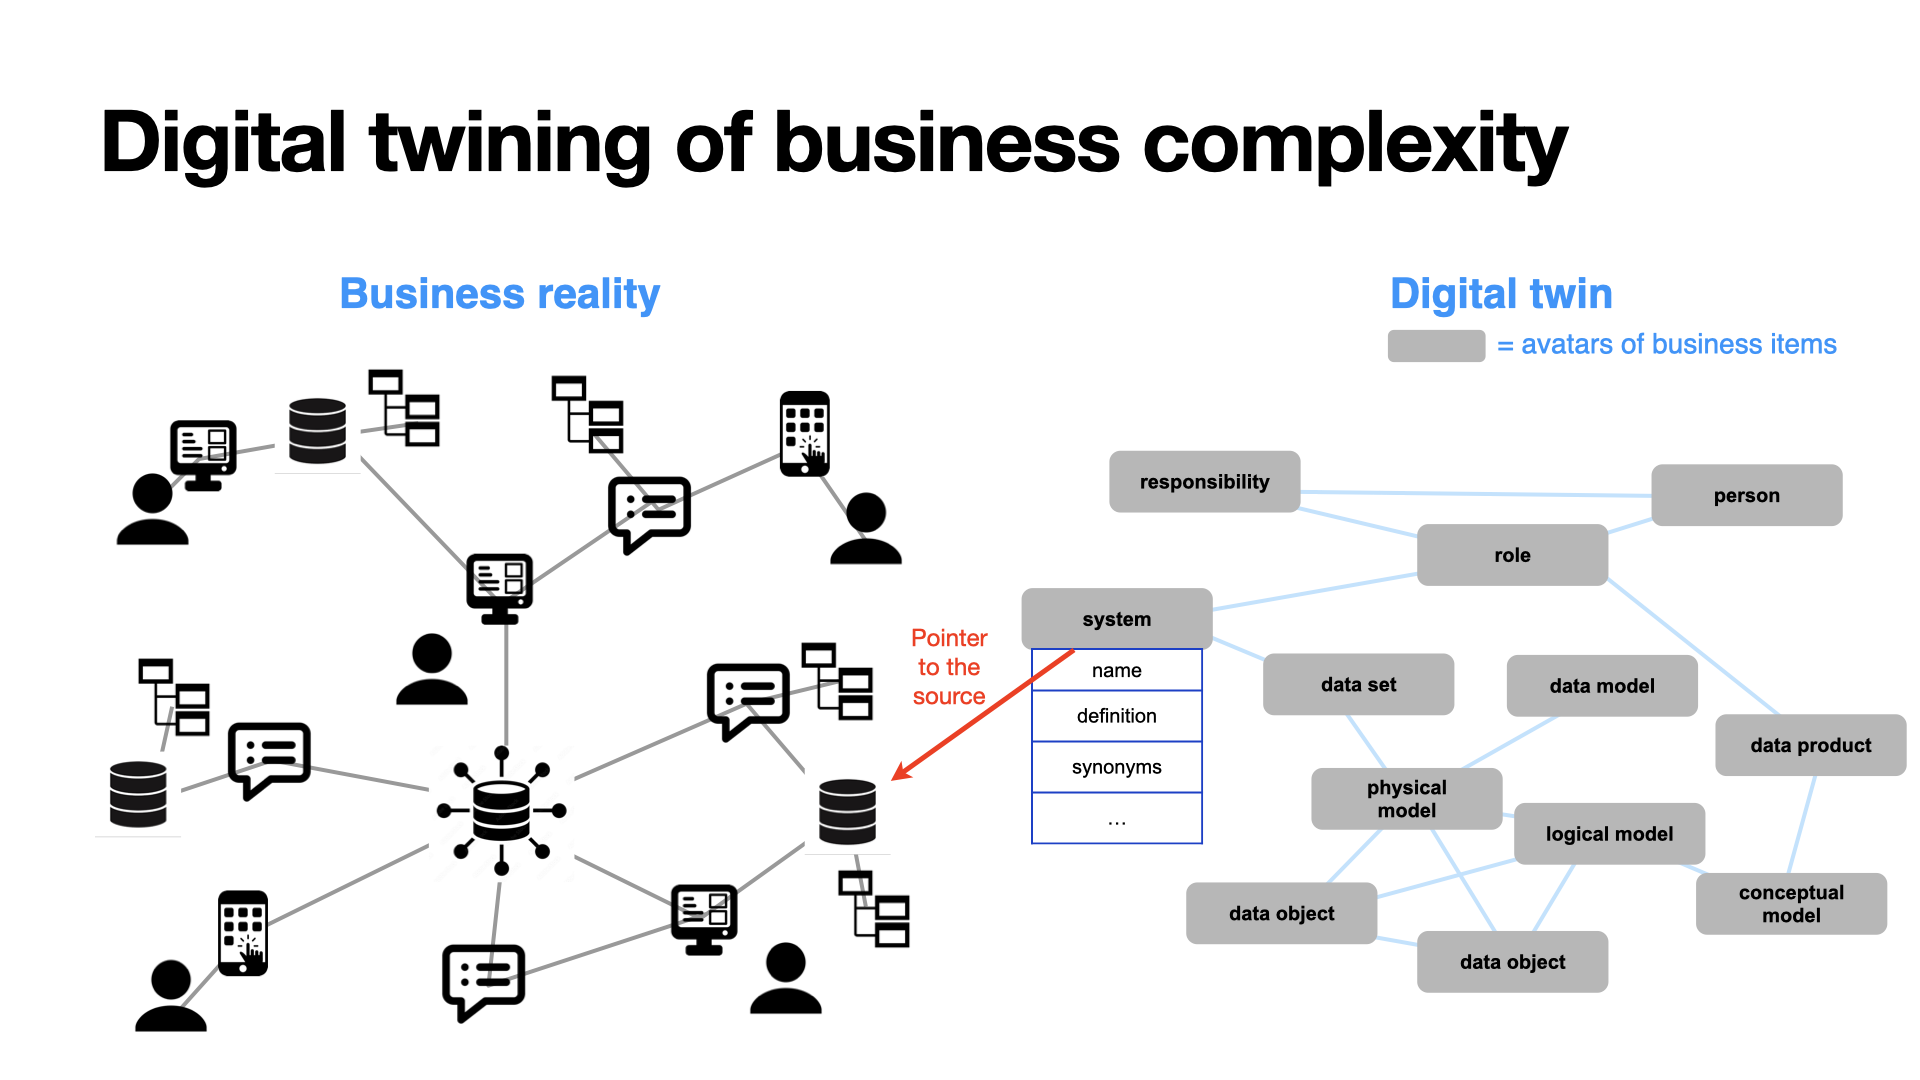
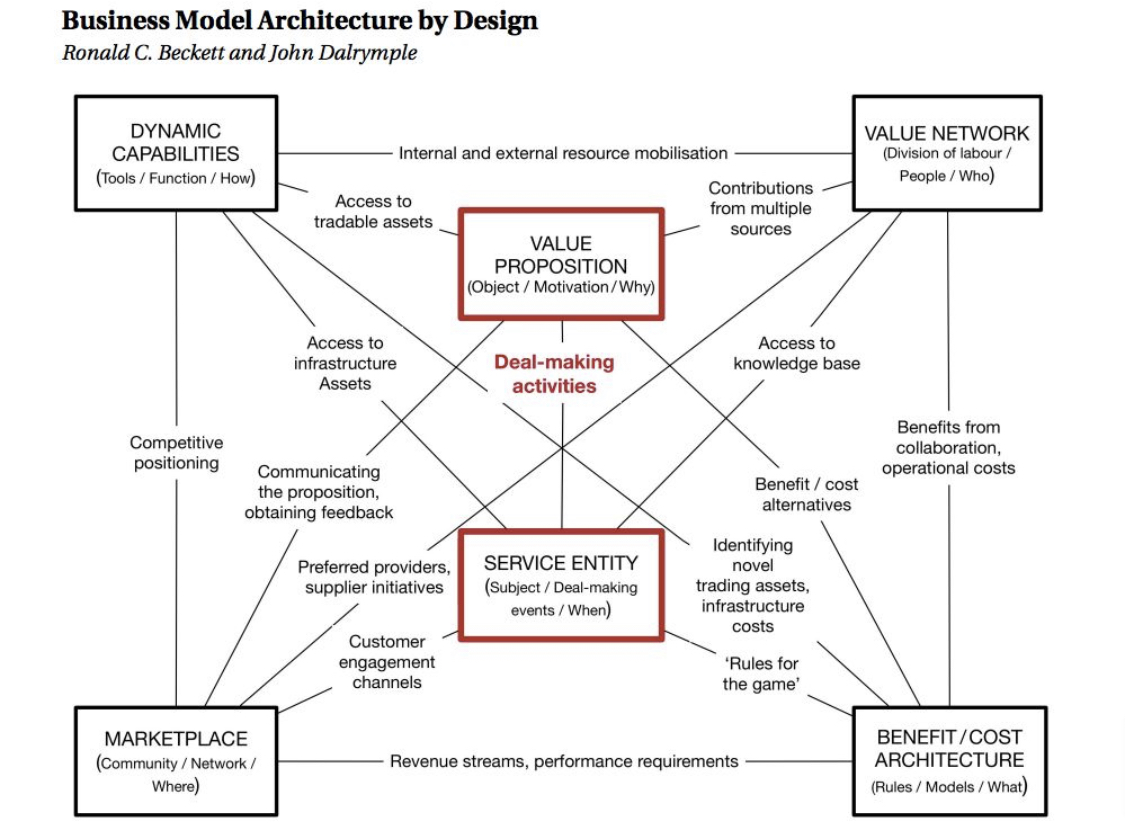
A machine-readable business map
Such a visual representation can be applied to anything but should be seen as a representation. You can think of the above as a map, just as an organization chart is a map.
There are several way to encode this map as something that a computer can understand, just as a blueprint is a graphic representation (a map) of a house, a piece of machinery, or an organization
When including the dynamic aspect of business changing over time, the map becomes a digital-twin of your business.
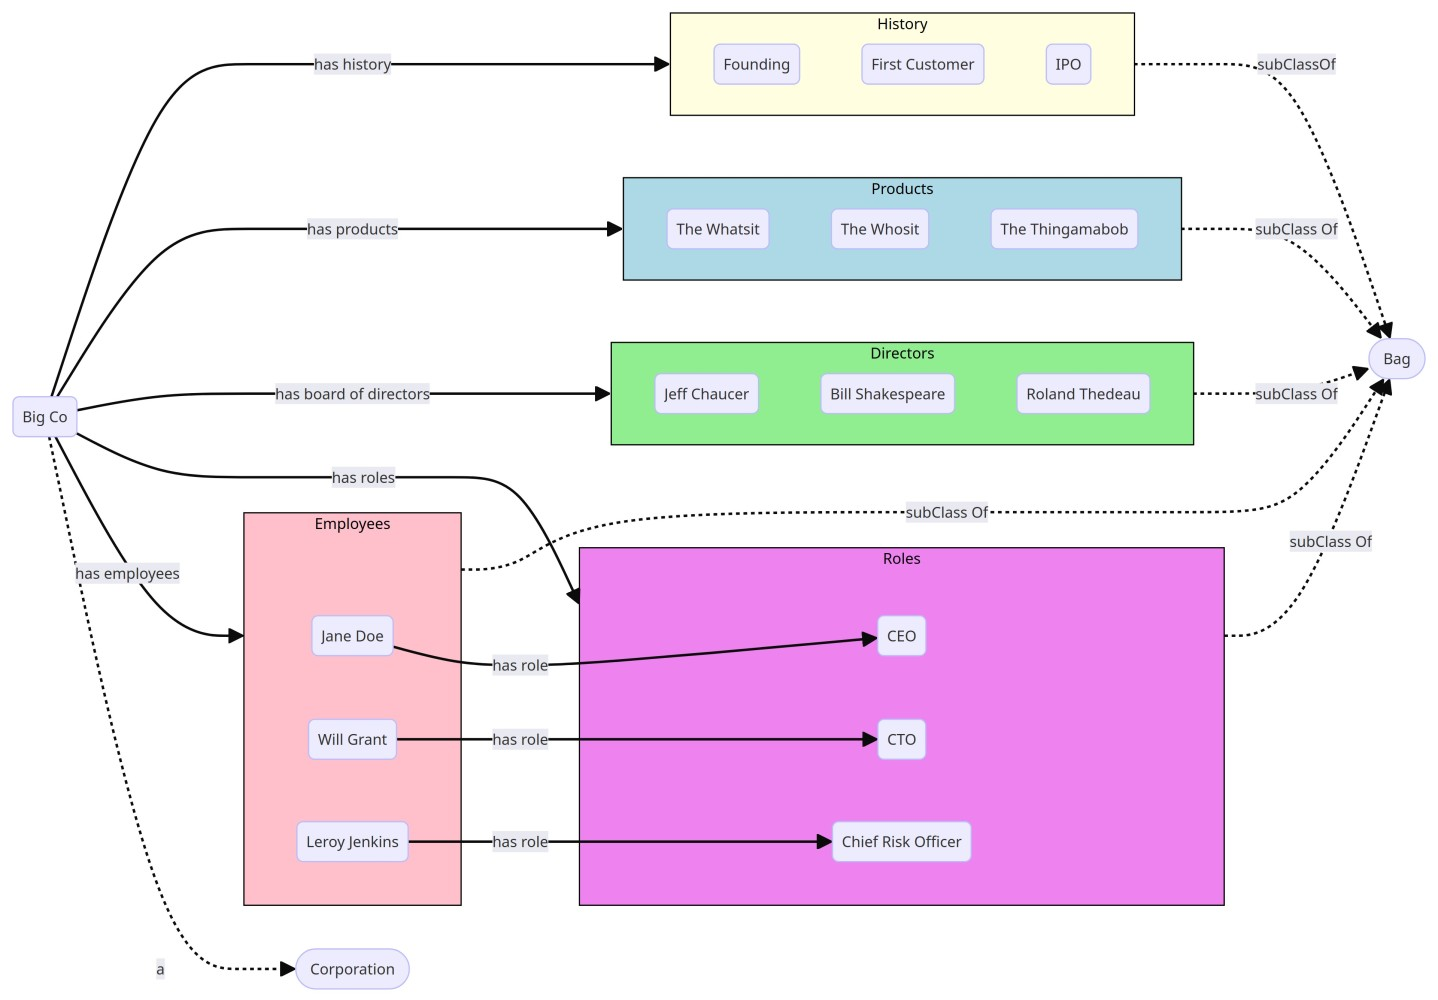
Look at your company,
You likely see things - people, clients or customers, products, processes, roles, revenue, etc.
Those things are connected in various ways, and those connections characterise your business; they are unique to you.
In mathematical terms, these things collectively form a graph.
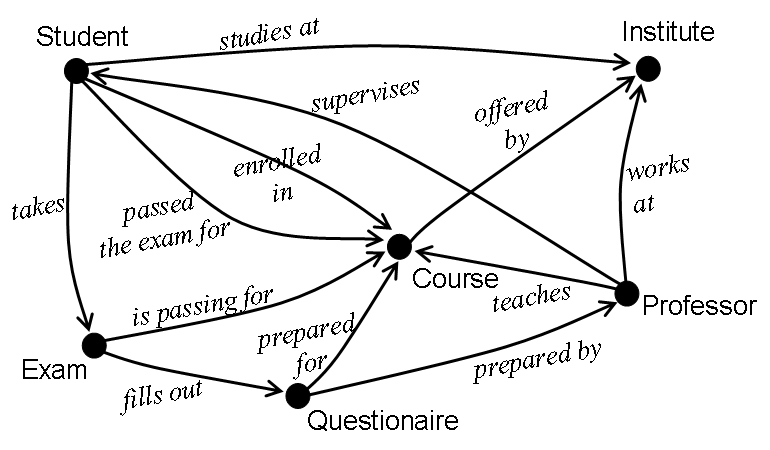
Student
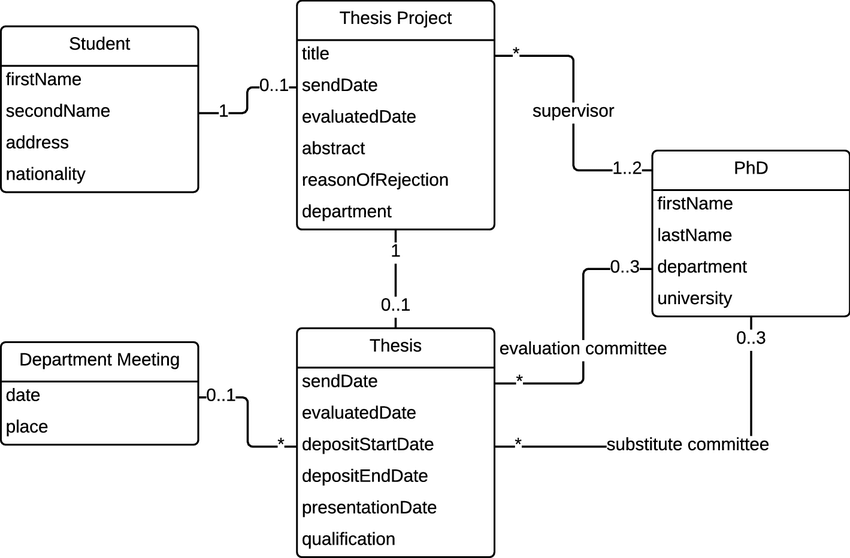
Conceptual modelling is a a universal way to:
- Simplify complexity by focusing on key concepts and relationships
- Enhance the understanding of a complex situation or system
- Create a base to share a common understanding and future discussions
- Provide a point of reference for solution designers to gather situation/system specifications
- Document a situation/system for future reference
Conceptual model should
- ... be available to all team members, to facilitate collaboration and iteration.
- ... be easily changeable, as a continuous reflection of up-to-date information.
- ... contain both visual and written forms of diagramming, to better explain the abstract concepts it may represent.
- ... establish relevant terms and concepts
- ... define said terms and concepts
- ... provide a basic structure for entities for a scope (domain, project...)
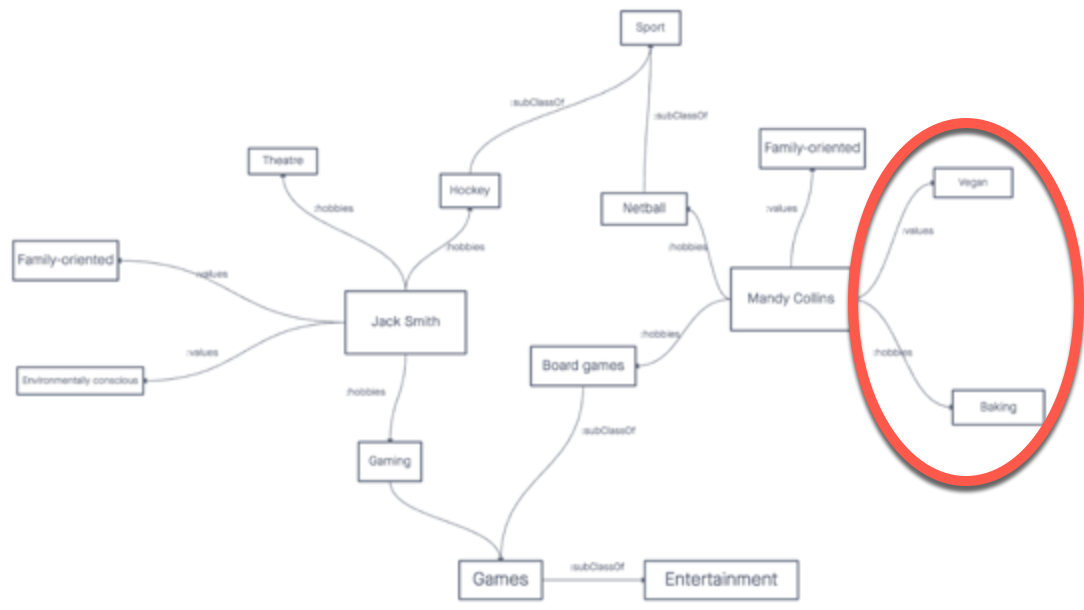
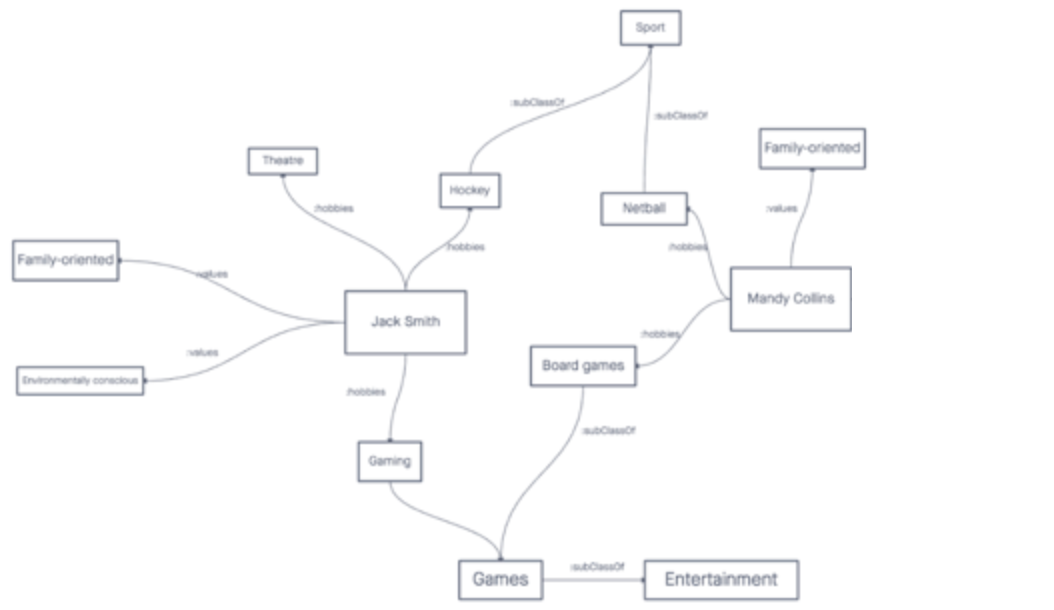
Definition: Models with concepts and relationships between them as a minimum and possibly with several constraints holding over them.
"Concepts" might be types, classes, individuals, values and "relationships" might be predicates, relations, associations... The precise naming depends on the type of model.
Example
Declarative statements
Automatic knowledge inference
"Anything is defined by what it relates to and how it relates to it."
Tim Berners-Lee
Examples
Project data in a VUCA context
- Is my my data highly-connected? Yes, to a complex context
- Is retrieving/querying (often) the data important? Yes, for monitoring and adjustment (fail/succeed fast)
- Does my data model change often? Yes, Volatility (in VUCA) and big data Velocity (in big data Vs)
Context modelling
Business context modelling
A model to monitor project added-value
Guess who I am?
Harness digital complexity
Document
System
Role
Person
Product owner
Modeling
Conceptual modeling
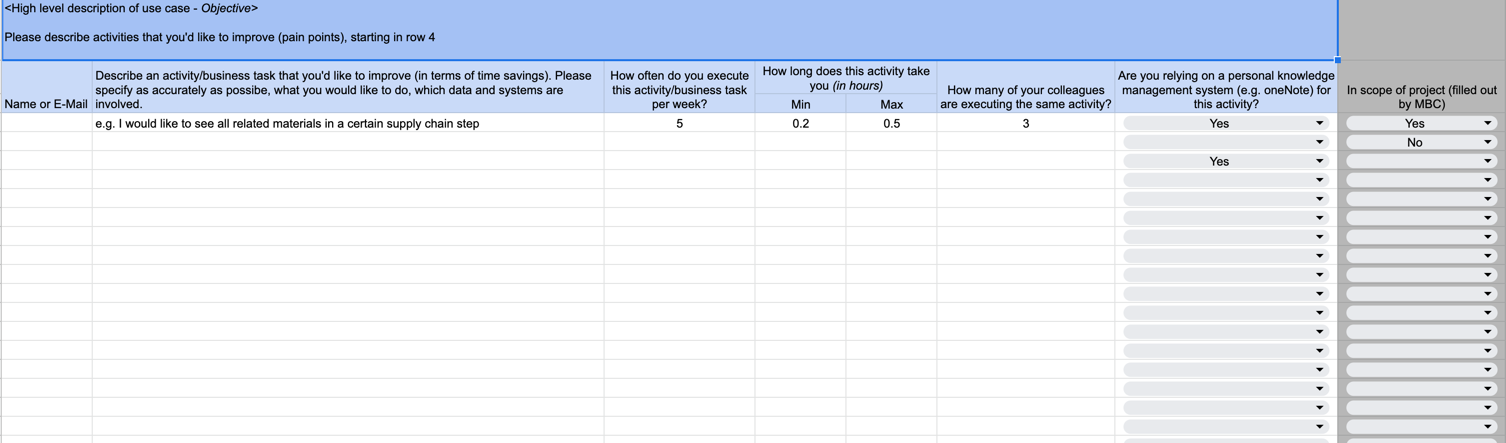
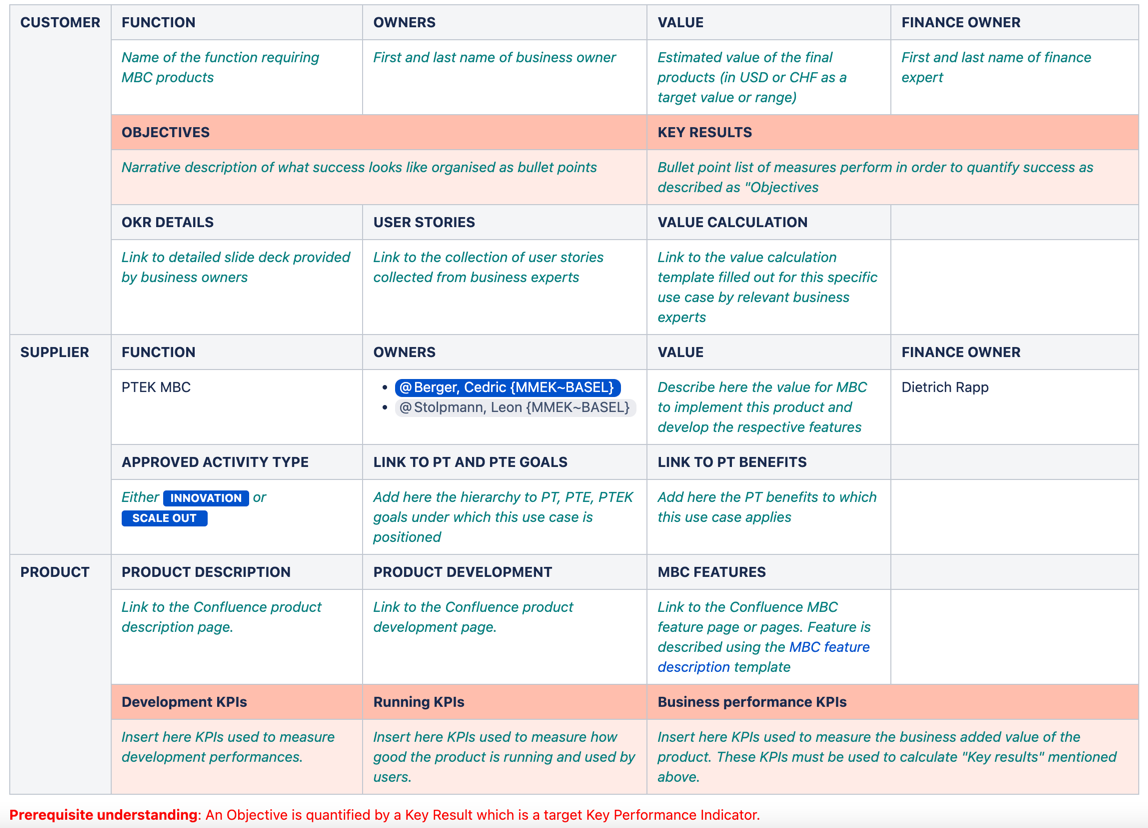
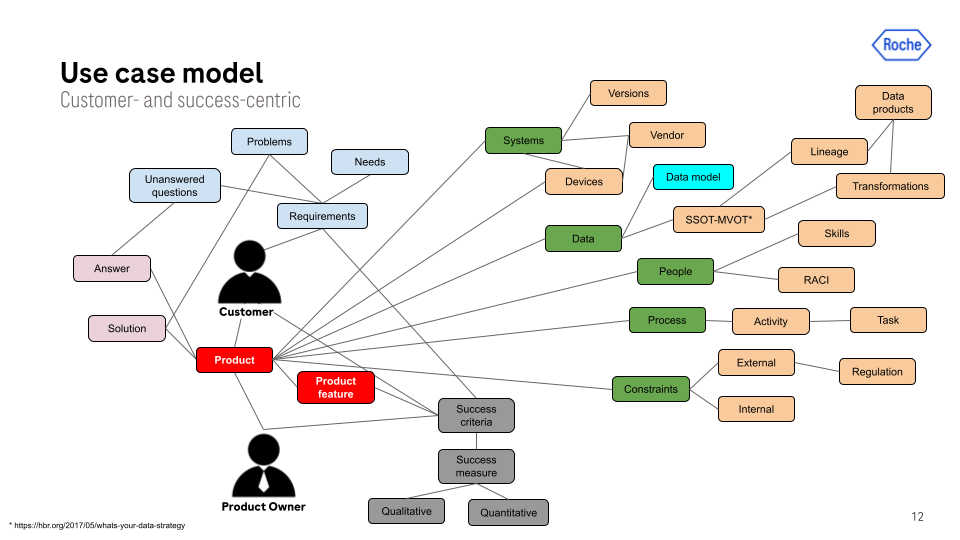
Use case description template
Money
... any other business asset
Business expert
Customer
Supplier
Use case
Planned added value
Jira ( JEE-rə) is a proprietary issue tracking product developed by Atlassian that allows bug tracking and agile project management.
Objectives (success narratives)
Alias: KPIs- A measure of performance
- A measurement and/or a calculation resulting in a value
- A definition of what this value is indicative for
Types of KPIs (for digital products/services)
- Development KPIs
- Running & usage KPIs
- Business performance KPIs
What is a (good) KPI
- Provide objective evidence of progress towards achieving a desired result
- Measure what is intended to be measured to help inform better decision making
- Offer a comparison that gauges the degree of performance change over time
- Can track efficiency, effectiveness, quality, timeliness, governance, compliance, behaviors, economics, project performance, personnel performance or resource utilization
- Are balanced between leading and lagging indicators
- Ideally automated
Ideal KPI
- Who, what, how: Be clear about who the audience is, what they want, and how they’re going to use the KPIs. This means working with your stakeholders to identify the core KPIs that map directly to their goals and strategy.
- SMART: Specific, Measurable, Attainable, Realistic, and Time-bound.
Iterate and evolve: Over time, see how you or your audience are using the set of KPIs and if you find that certain ones aren’t relevant, remove or replace them.
See also Objectives and Key Results
Leading and lagging KPIs
Leading KPIs
- Early indicator of the performance
- Measure performance before the business or process result starts to follow a particular pattern or trend
- Indicate whether the project or product implementation is moving in the right direction and what changes need to happen so as it can reach its goal/objective.
Lagging KPIs
- Late indicator of the performance
- Measure performance after the business or process follow a pattern or trend and is used to confirm long-term trends
- Indicate whether an initiative is on track with respect to its final objectives
Examples
- User adoption/retention rate: An increasing user adoption and retention rate can indicate that the product growth is in the right direction and product monetization goals (lagging KPIs) can be achieved.
- Rate of JIRA stories points delivered in every sprint: A constant or uptrend on this KPI can be an indicator to the project success which then can be used to think about the revenue generation (lagging KPI) from successful project execution
Most important KPIs


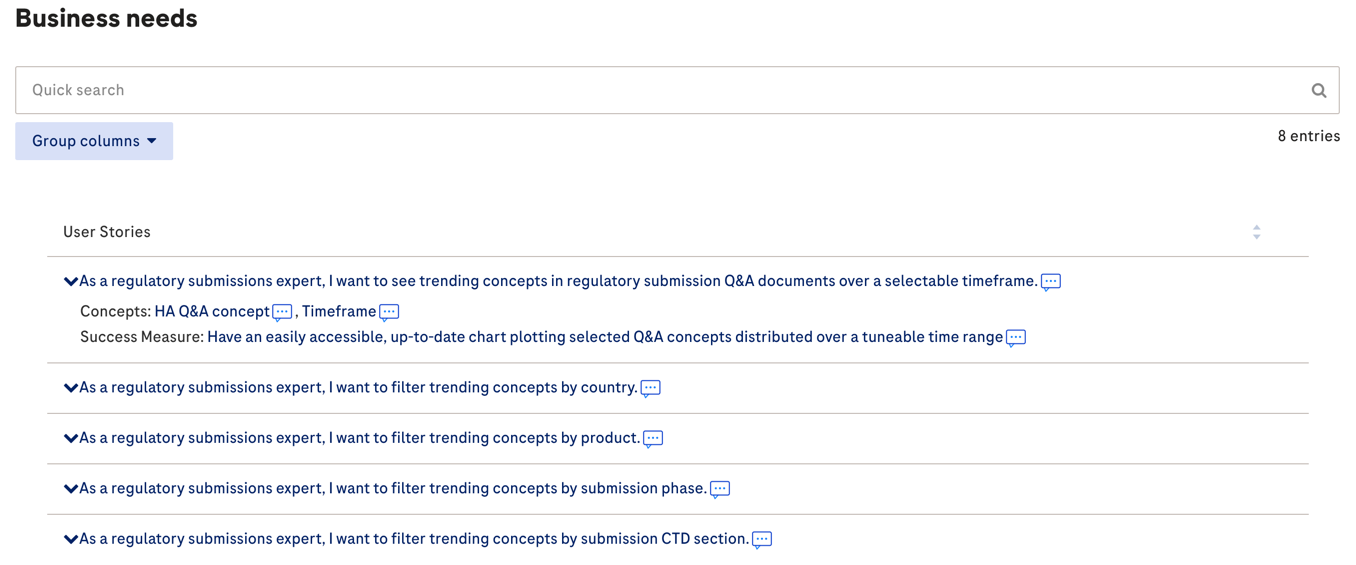
Stories
Digital solution
- product
- service
Digital expert
Technical capabilities
Features
Epics
Key results (success measures)
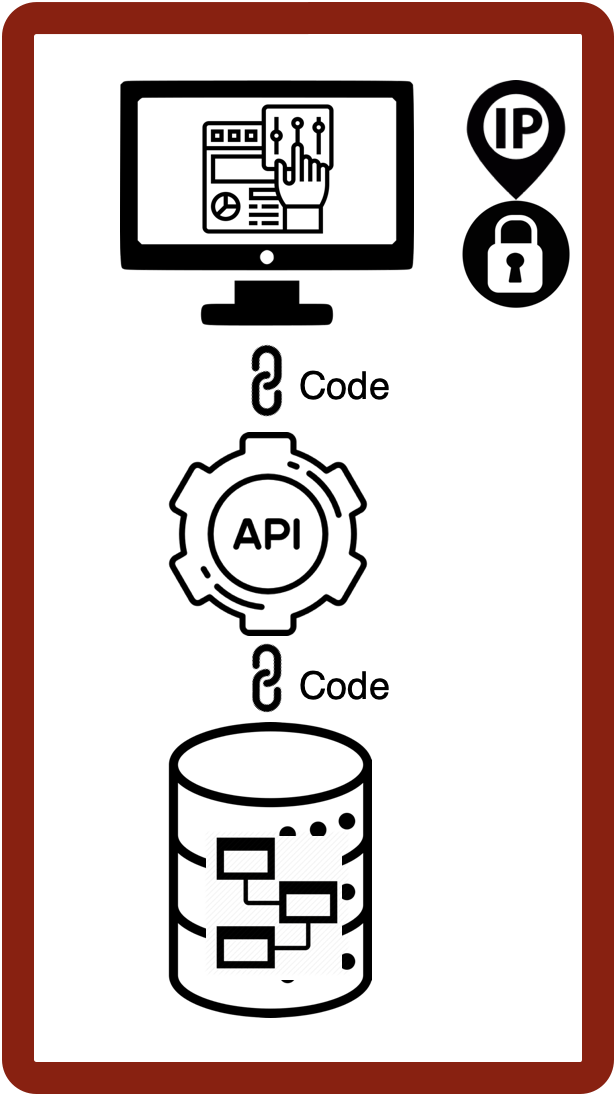
API

Business needs/requirements
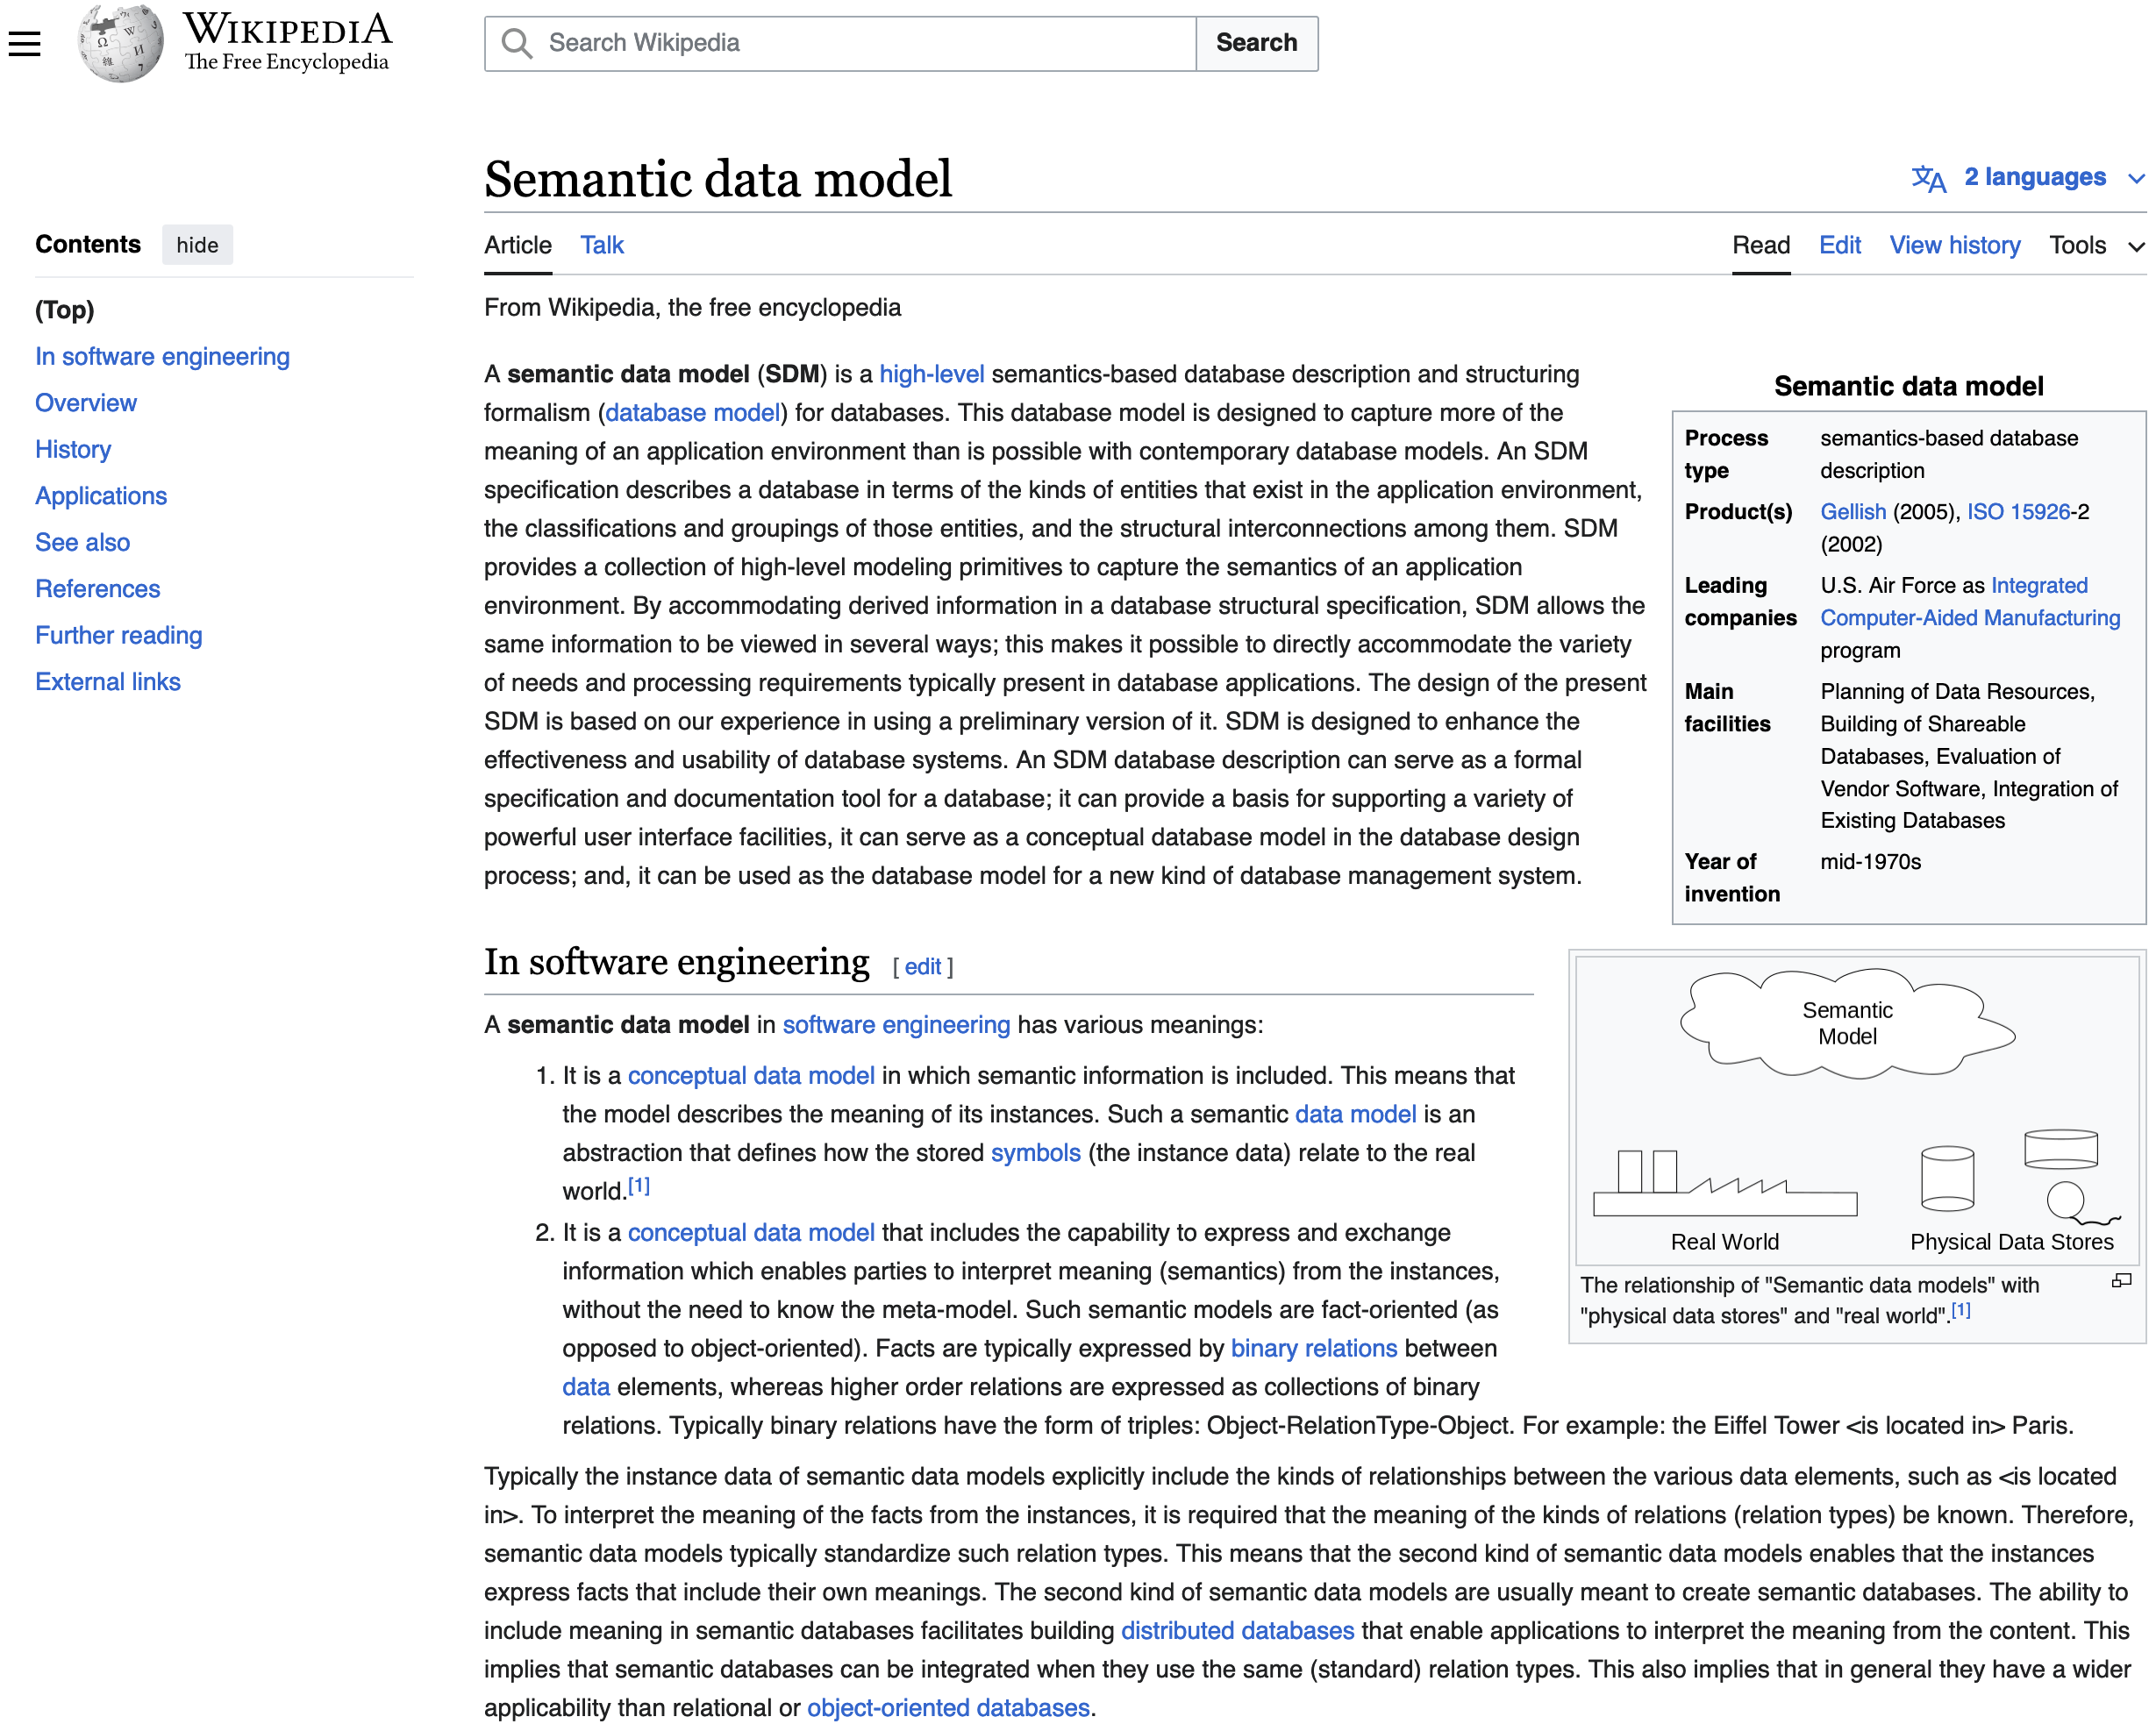
Semantic model
Subject Matter Experts
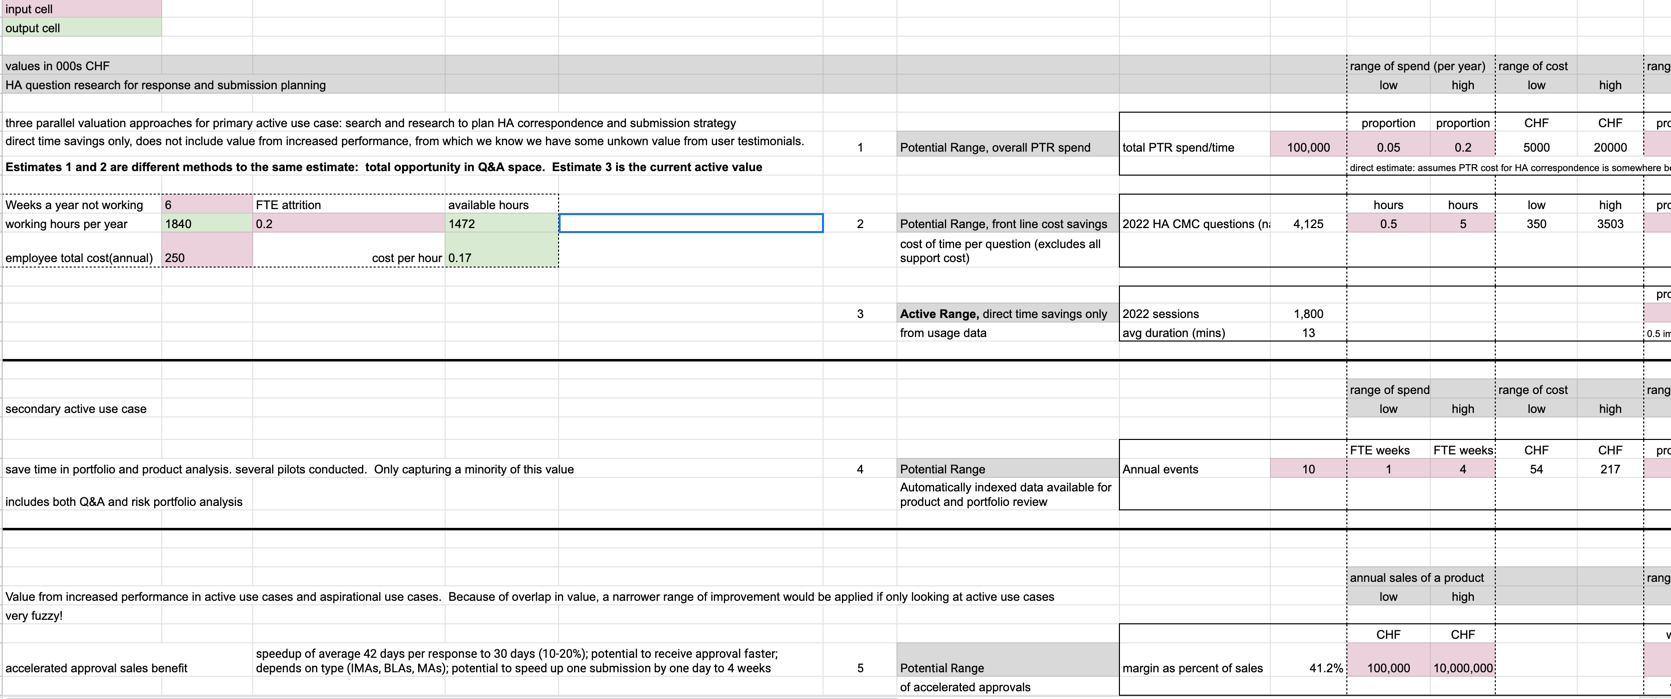
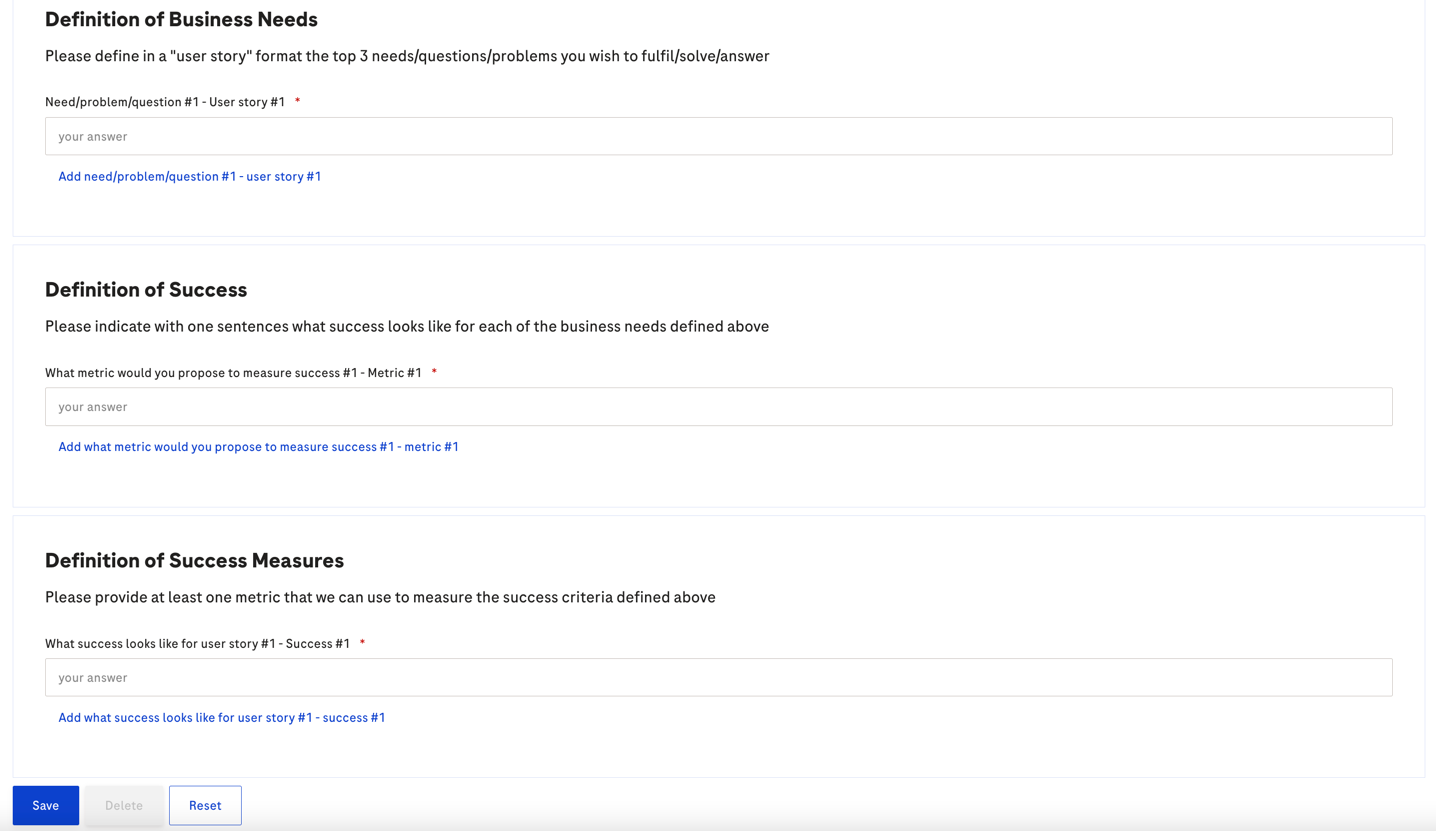
Valuation form template
Global context
Global context
How does it impacts project management?
Key requirements to manage projects well in a VUCA environment:
- Knowledge
- Vision (business knowledge + imagination/creativity)
- Agility
II) Discover new ways of working that leverage open standards to harness complexity, better understand and make fact-based decision
45 min

Industry
...
Success defintion
Team work
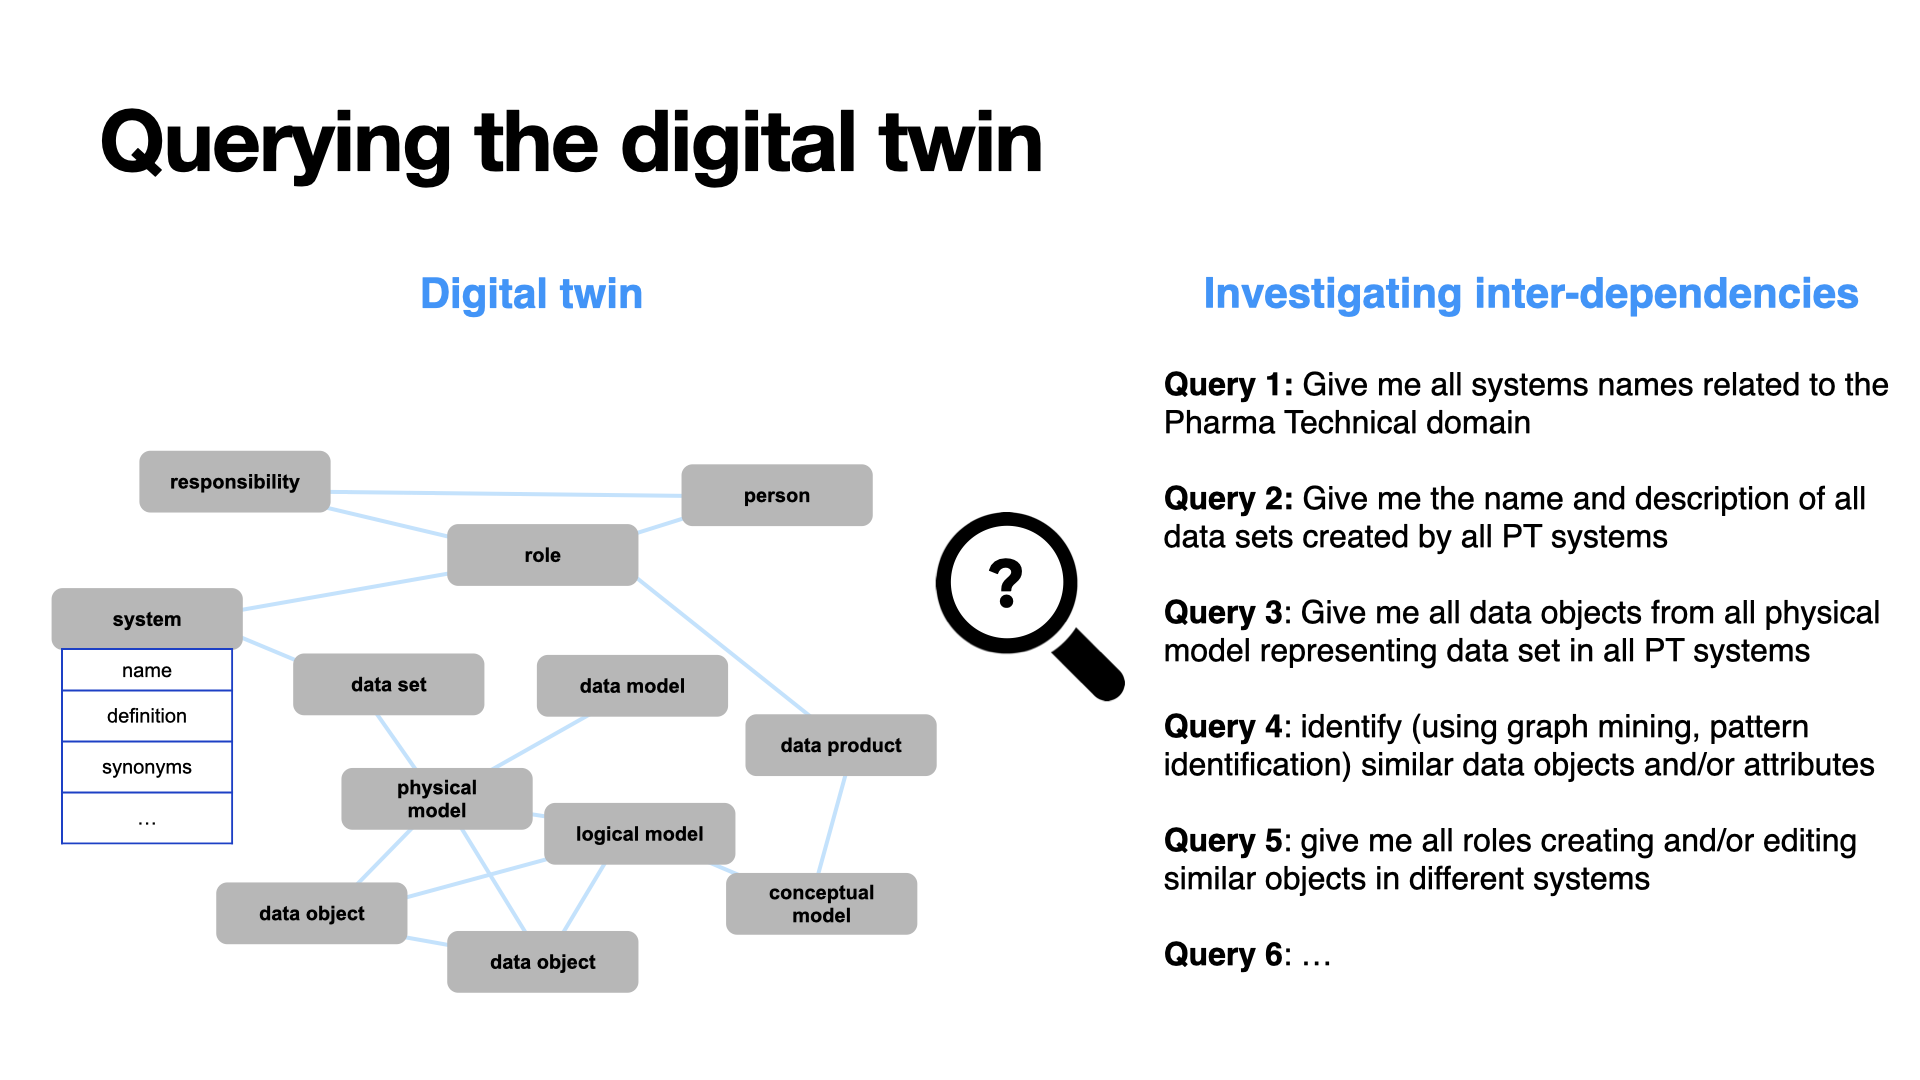
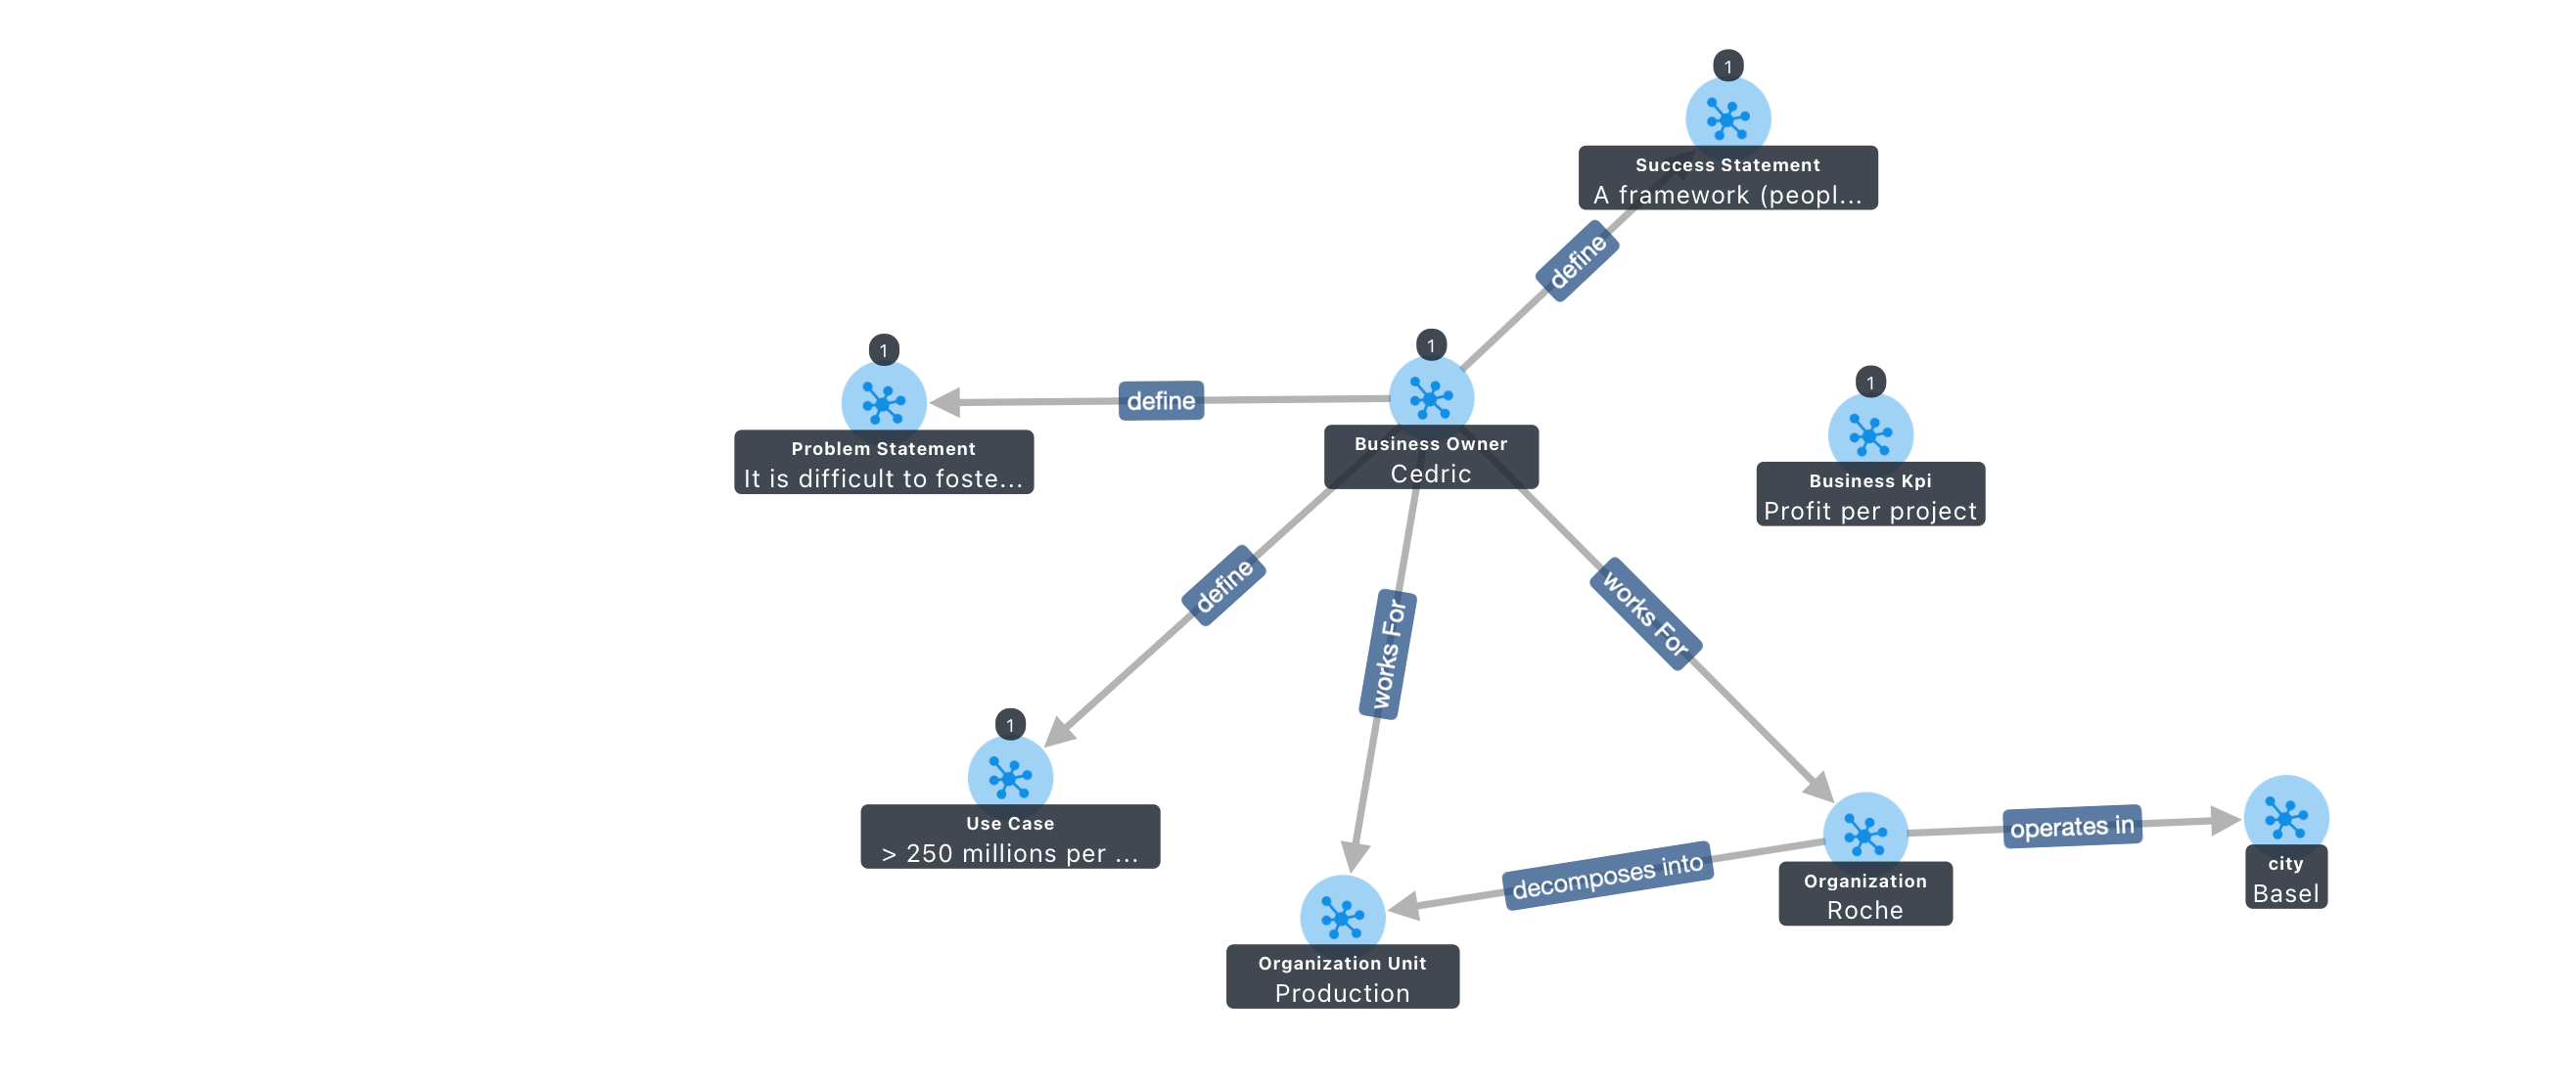
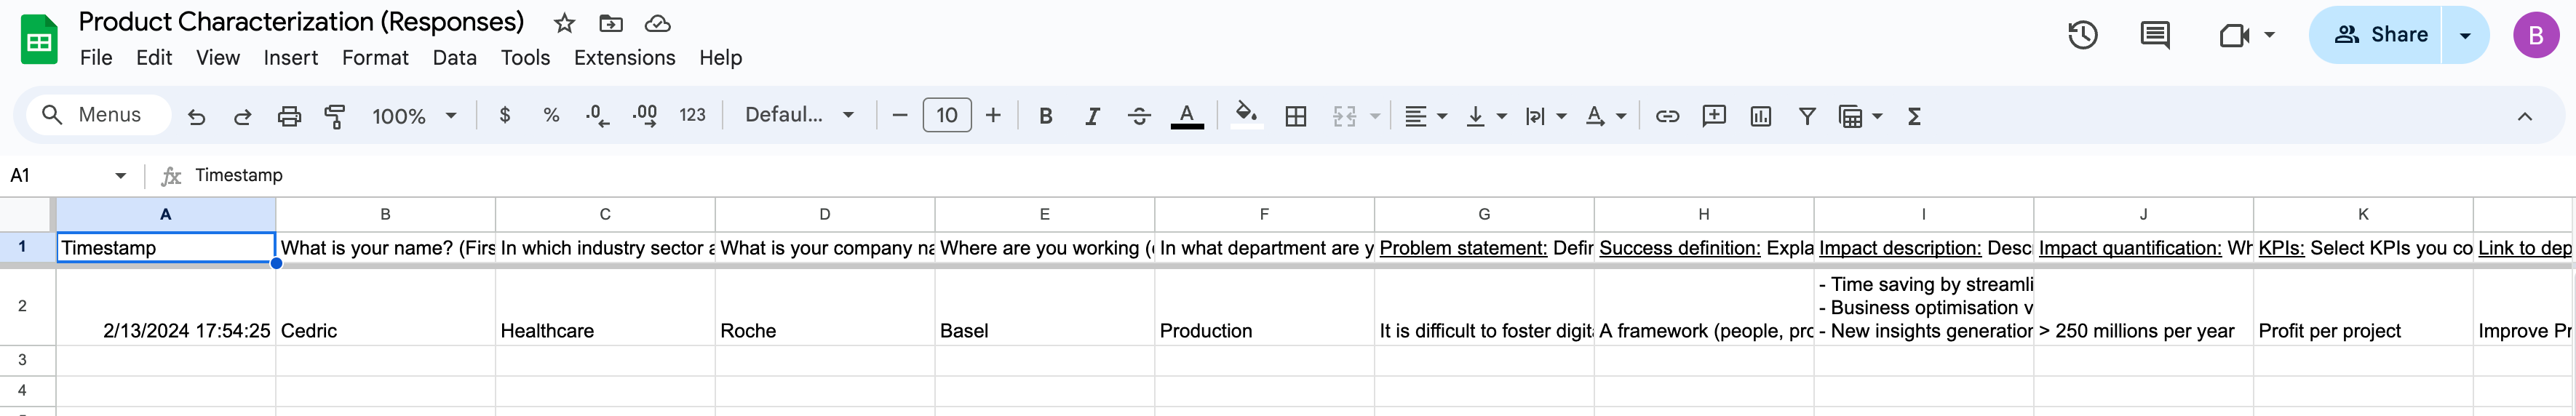
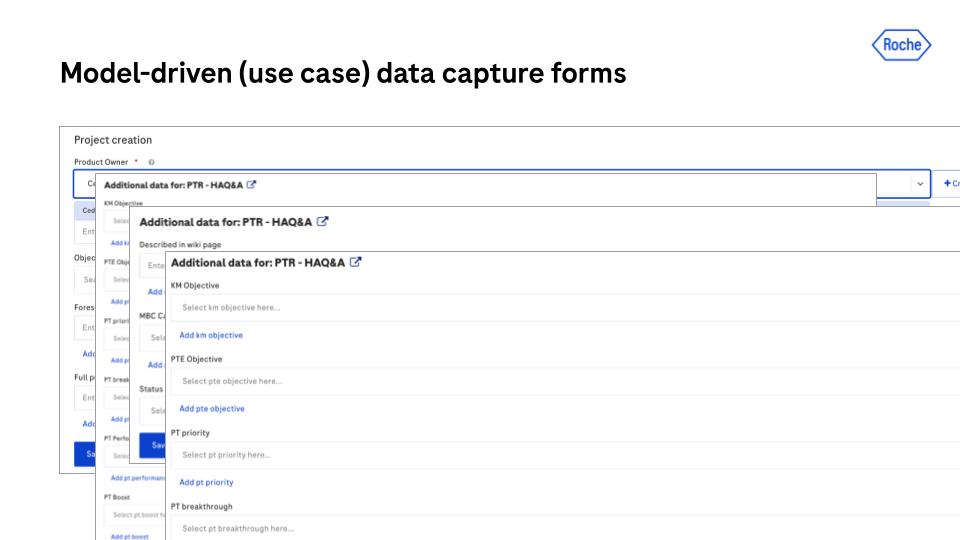
1. Populate a form to capture data about your project and create a knowledge graph with all of your project data
2. Integrate the data thanks to a predefined model/ontology
3. Enrich the data using existing graph data and ML
4. Query the resulting enriched data set
Fill out the following gFrom with real or fake data
15 min
Location
Department
Company
Problem statement
Based on Agile Manifesto
Scaleable as per SAFe
Why +?
Agile was designed to better develop websites for which developers have clear requirements
Developing AI/ML digital products and service requires to take in account other factors such as
- DS/AI projects requires a lot of experimentation; the outcome of Probabilistic models in ML is not the same as a user requirement
- DS/AI projects success depends on input data quality (often underestimated and not considered as part of the project by sponsors); quality data is a must-have to train a ML model
- DS/AI projects require specific measures of success
- A model being successful in terms of accuracy may not mean that there will be business benefits from the outputs
- Hard to measure what is a 80% good enough solution; requires post-deployment adjustment/maintenance
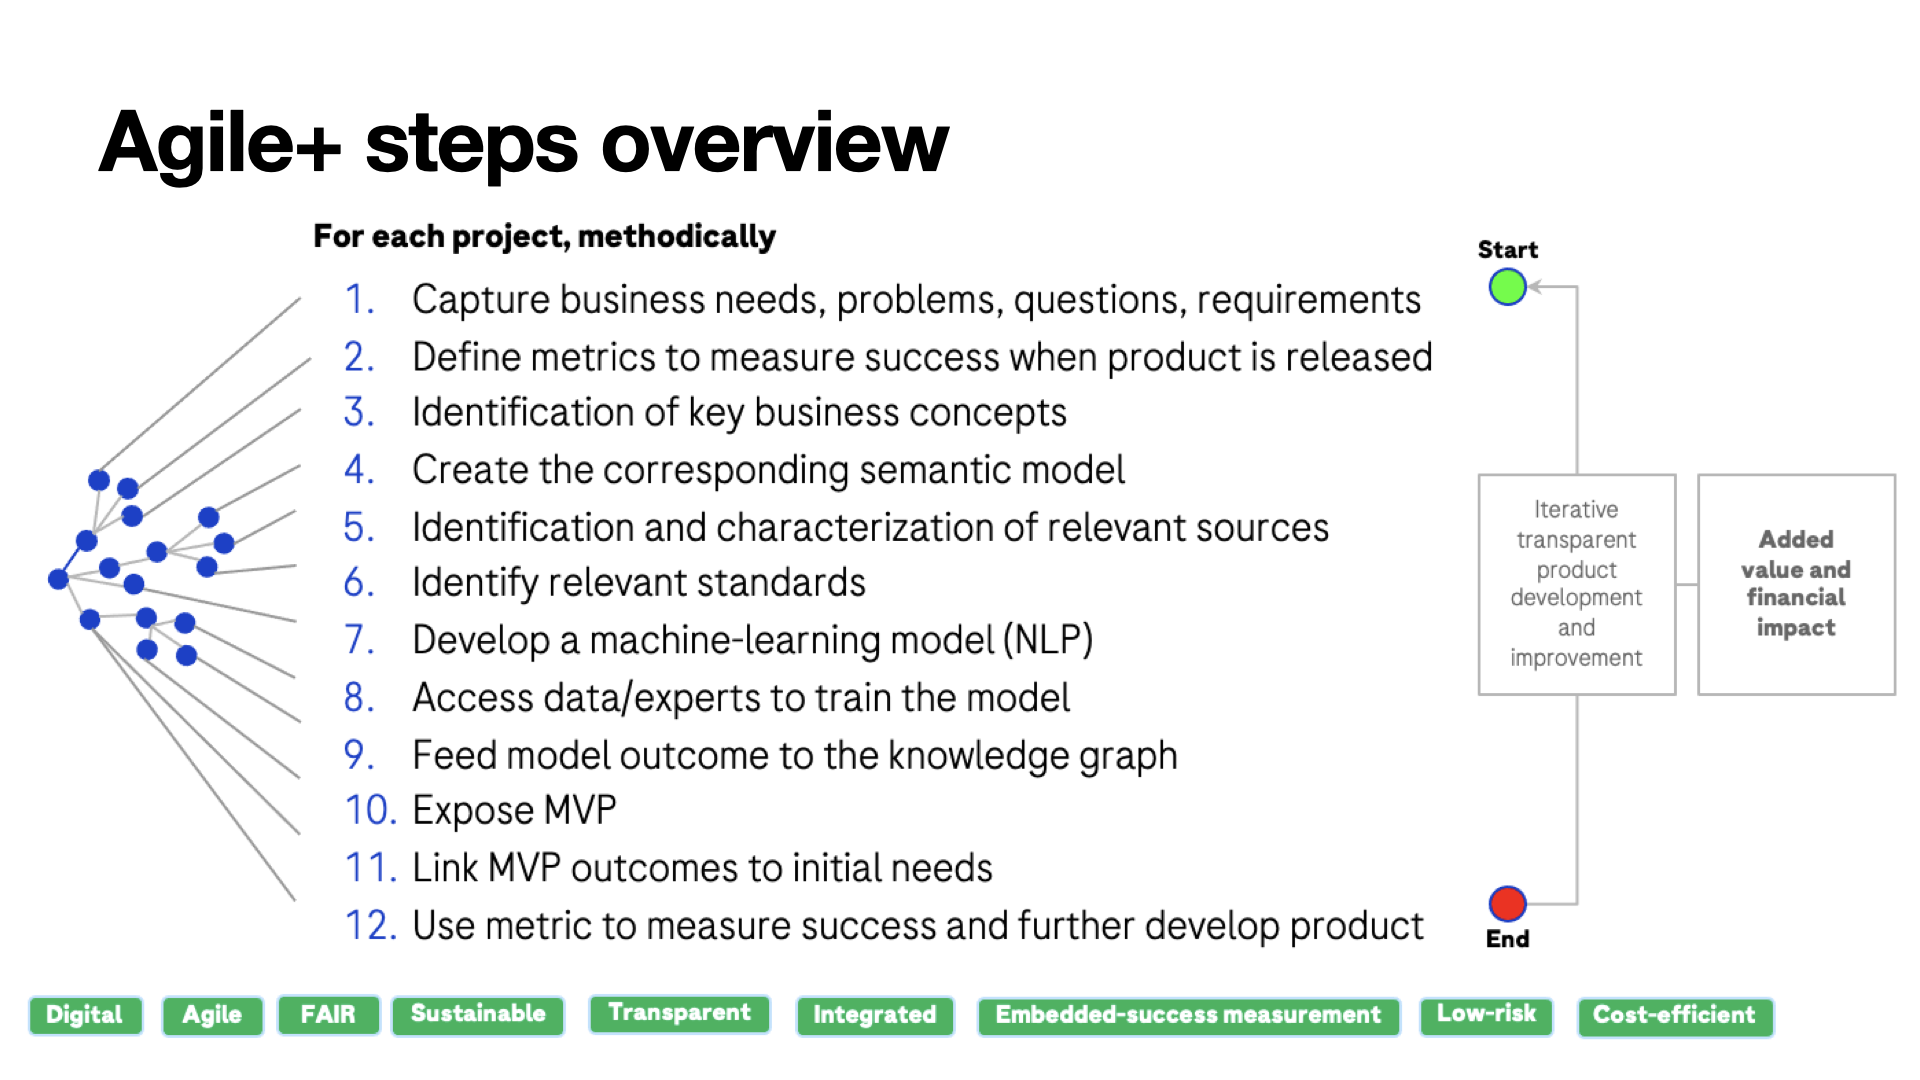
The Agile+ step sequence
- Capture business needs, problems, questions, requirements
- Define metrics to measure success when product is released
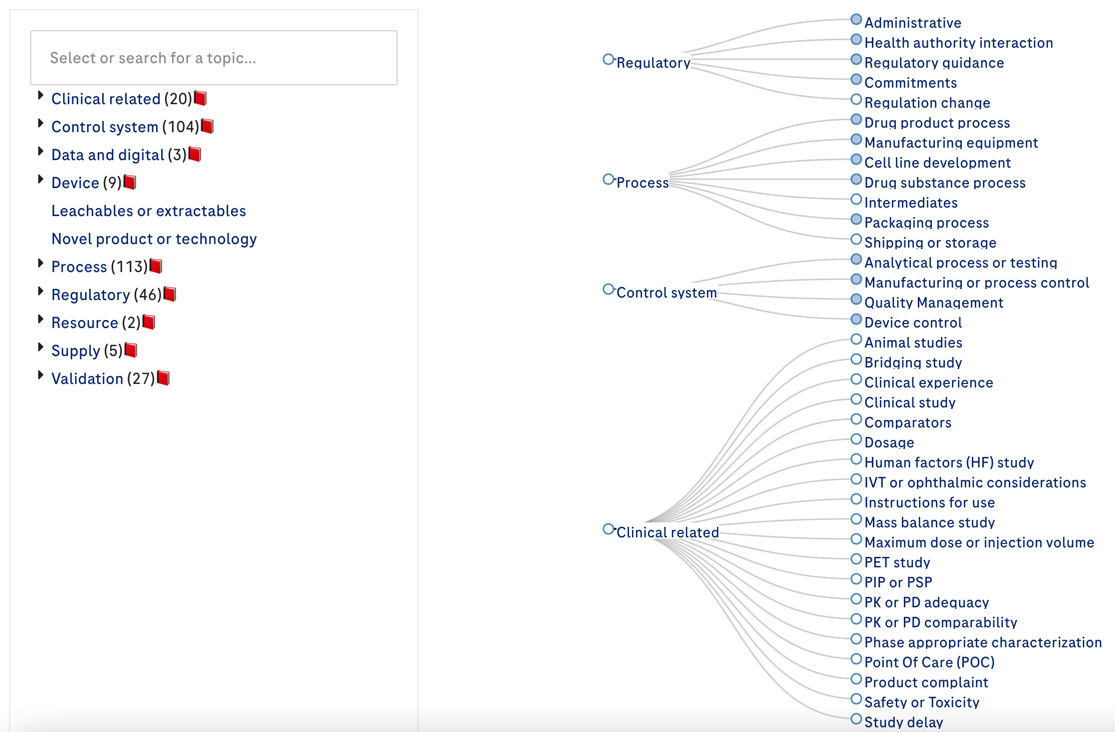
- Identification of key business concepts
- Create the corresponding semantic model
- Identification and characterization of relevant sources
- Identify relevant standards
- Develop a machine-learning model (NLP)
- Access data/experts to train the model
- Feed model outcome to the knowledge graph
- Expose MVP
- Link MVP outcomes to initial needs
- Use metric to measure success and further develop product
- Goes back to point # 1
Advantages of Agile+
Because all Agile+ metadata is collected in a semantic knowledge graph, this methodology is
- Digital i.e. machine readable and queriable
- Agile
- FAIR by-design
- Sustainable (using open standards)
- Transparent (the content of the graph is business-use validated and displayed/queried transparently)
- Integrated (this is linked data)
- Success measurement is embedded in the methodology
- Low-risk (no business disruption)
- Cost-efficient (no vendor lock-in)
From Sequeda
1️⃣ Success is defined by business questions, not technical
Start with the business questions you want answers to – know WHO is asking and WHY! And no tech-talk, please! Understand how that question is being answered today and quantify it. Measure the new solution's improvement based on that!
2️⃣ Have the right people in the room
Three personas: 1) Business folks: provide the business question and live the day to day pain 2) Data engineer: built the data lake, write ad-hoc queries, know where the bodies are buried 3) Knowledge engineer: bridge between data and business, "people person" with the business users and geek out with the data folks. They grasp the business context even if it's outside their domain, translate it to the technical language. Push back on both the business and data folks when something is not aligning.
3️⃣ The Pay as you Methodology
Don't throw sh** at the wall. You must have a methodology. We follow the Pay as you go Methodology (link in comments). Start with a question (aka competency question) and go through three phases 1) Knowledge capture: understand the question, capture the concepts, attributes and relationships represented in the questions, identify where is the granular data to answer those questions. This becomes the ontology and mappings 2) Knowledge implementation: formalize the ontology and mappings as code 3) Chat with the data: set up the system, test, validate. Iterate for the next question
4️⃣ Get unstuck with the Iron thread approach
Take a specific instance, for example a Customer by ID. In the ontology: customers places Orders, etc. Look up the customer id in the original source system and see how many orders they should have. Then check the mappings and see if you get the same results. If you aren't, you found the problem. If you are, keep going. Eventually you will have that thread that will go through the ontology. Try it again with another customer ID. The thread gets stronger.
5️⃣ Eating your vegetables can be fun
The conclusion of our benchmark research is that by investing in knowledge graphs, the accuracy of question answering over enterprise sql data with LLMs increases. The key word here is "investing" and this means starting with a strong foundation of metadata and semantics. This may feel like eating your vegetables. The objective isn't to have a perfect metadata of all your data estate. That's infeasible. Just have it for the parts that are going to be used in answering the questions. When you go through the methodology and the iron thread, you will be learning a lot about the data and the business. Add all those learnings in the data catalog. Start small, think big
See Crownpoint methodology presented at ISO

Creation date: 2021-12-06 17:50
Last modified: 2022-03-09 15:06
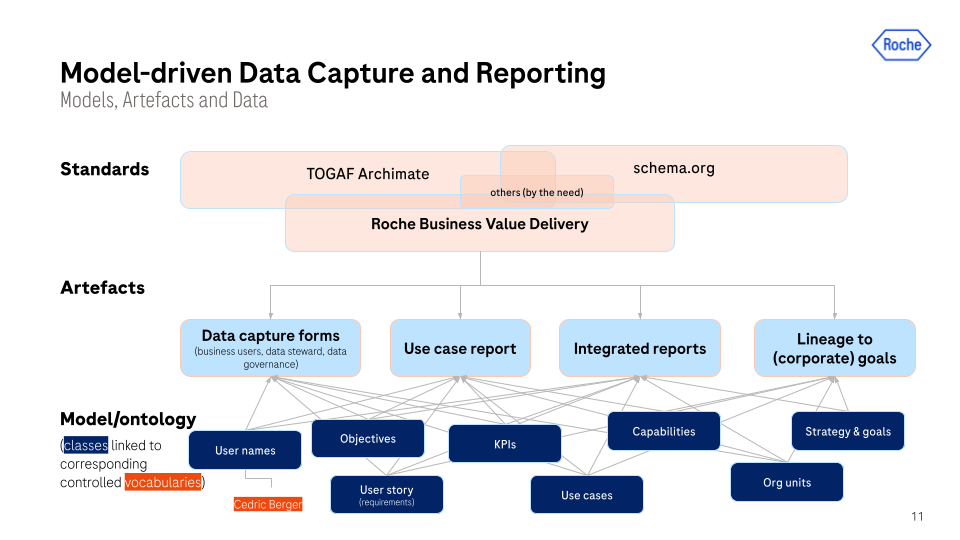
Tag: #rochetime - Using slides, spreadsheets, documents for PM has not changed for decades; it is not fit-for-purpose in a VUCA/digital environment
- We propose here a framework
- methodology (focus on capturing VoC and success metrics)
- a technology stack
to collect, manage, standardise and publish PM data and metadata
- We use open standards: no lock-in and full freedom to operate
- Entities in our framework is human- and machine-readable therefor enabling
- Automatisation
- Insight generation
Why?
- The framework helps you to harness a VUCA environment
- collect all the required knowledge to act test and act fast (identify and simulate interdependencies, impact analysis)
- support creativity to face any unforeseen situation (ML-driven insight generation, question answering)
- the use of open-standard and internal talents enable true agility in order to plug & play any missing data set, dashboard, expertise
- Measuring success automatically is embedded in the framework (PM methodology)
- Fully transparent with traceability to source-of-truth
- Iteratively using the framework enables to build a digital twin of the organization
1. People
It is all about people
- Get knowledge:
- Internally -> education
- Externally -> special consultants
- Maintain knowledge:
- Small business/scope: 1 FTE
- Large business/scope: knowledge management team
2. Technology
Architecture and tech stack
- Build basic framework:
- Small business/scope: open-source solutions, 3-6 months, CHF 20-50k
- Large business/scope: professional solutions, 6-24 months, CHF 120-500k
- Maintain framework:
- Small business/scope: 5k per year
- Large business/scope: 80-120k per year
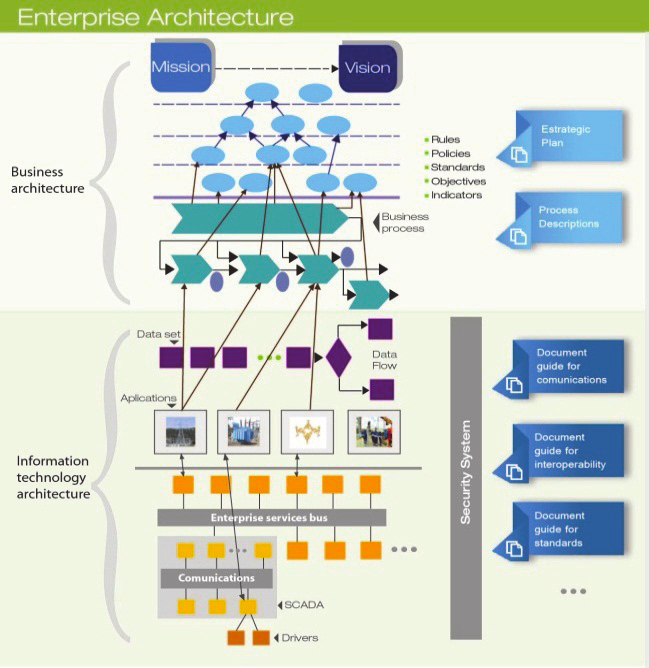
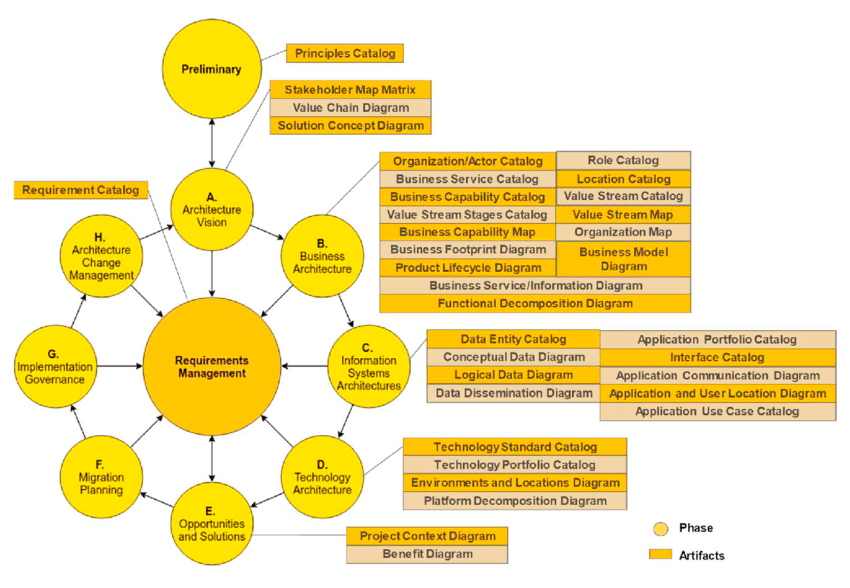
Enterprise architecture (EA) is a business function concerned with the structures and behaviors of a business, especially business roles and processes that create and use business data.
A well-defined practice for conducting enterprise analysis, design, planning, and implementation, using a comprehensive approach at all times, for the successful development and execution of strategy. Enterprise architecture applies architecture principles and practices to guide organizations through the business, information, process, and technology changes necessary to execute their strategies. These practices utilize the various aspects of an enterprise to identify, motivate, and achieve these changes.
See also Business architecture and Manufacturing Execution Systems

What is an enterprise architecture (EA)?
An enterprise architecture (EA) is a conceptual blueprint that defines the structure and operation of organizations. The intent of enterprise architecture is to determine how an organization can effectively achieve its current and future objectives. Enterprise architecture involves the practice of analyzing, planning, designing and eventual implementing of analysis on an enterprise.
Enterprise architecture helps businesses going through digital transformation, since EA focuses on bringing both legacy applications and processes together in an attempt to form a seamless environment. The use of EA frameworks rose in response to increases in business technologies during the 1980s, when a need for a way to respond to rapid technology growth was integral to business strategy. This process later expanded to the entirety of a business, not just IT. This way, the rest of the business would be ensured to be aligned with digital transformation.
Concepts of enterprise architecture are variable, so it will not look the same for each organization. Different parts of an organization may also view EA differently. For example, programmers and other technical IT professionals regard enterprise architecture strategies in terms of the infrastructure, application and management components under their control. However, enterprise architects are still responsible for enacting business structure analysis.
The importance of enterprise architecture
Enterprise architecture will help multiple departments in a business understand the broader business model and articulate challenges and business risks. Because of this, enterprise architecture has an important role in unifying and coordinating departmental processes across an organization. Being able to access and understand business capability should also help individuals identify gaps in their business, and from there, they can make more informed decisions.
The purpose of enterprise architecture
The main goals of enterprise architecture may be to create a map or blueprint of the structure and operations of an organization. This blueprint should include information such as a map of IT assets and business processes.
Other common goals include promoting team alignment and standardization. This can be done in part by unifying environments across teams and organizations. Guidance is normally based on an organization's business requirements.
The enterprise architecture process
Microsoft's Michael Platt, a director in the strategic projects group, offers a view of enterprise architecture as containing four points of view: the business perspective, the application perspective, the information perspective and the technology perspective. The business perspective defines the processes and standards by which the business operates on a day-to-day basis. The application perspective defines the interactions among the processes and standards used by the organization. The information perspective defines and classifies the raw data (such as document files, databases, images, presentations and spreadsheets) that the organization requires to operate efficiently. The technology perspective defines the hardware, operating systems, programming and networking tools used by the organization.
The term may have various meanings to professionals in different areas who work with different EA frameworks. For example, programmers and other technical IT professionals regard enterprise architecture strategies in terms of the infrastructure, application and management components under they have control over.
High-level programmers will use enterprise architecture when referring to the hardware and software components in a design. For a website, that might comprise a web server, database, the NoSQL database cache, the API endpoints and the content delivery network.
For technical enterprise architecture descriptions, EA could revolve around the context of software architecture, systems architecture deployment types and other steps like testing.
Others could view enterprise architecture based on quality attributes. These are attributes that must exist for software to work and are unlikely to fit in a specification document. Examples include reliability, capacity, scalability and security. Quality elements are not functional requirements, but are ways to determine acceptable operating conditions and necessary tradeoffs to get there.
Enterprise architecture, in a business context, may have organizations distinguish their enterprise architecture from the technical architecture required to build and run applications. Working from within an enterprise architecture framework will help define this.
Enterprise architecture models and methodologies
Enterprise architectures are typically implemented as frameworks. There are many different frameworks, and some will be a better fit than others when it comes to any one organization. For example, a framework focused on consistency and relationships between various parts of an overarching enterprise will be more helpful to larger organizations with many moving parts compared to small ones. In this case, a framework like the Unified Architecture Framework (UAF) may work.
Some example frameworks include:
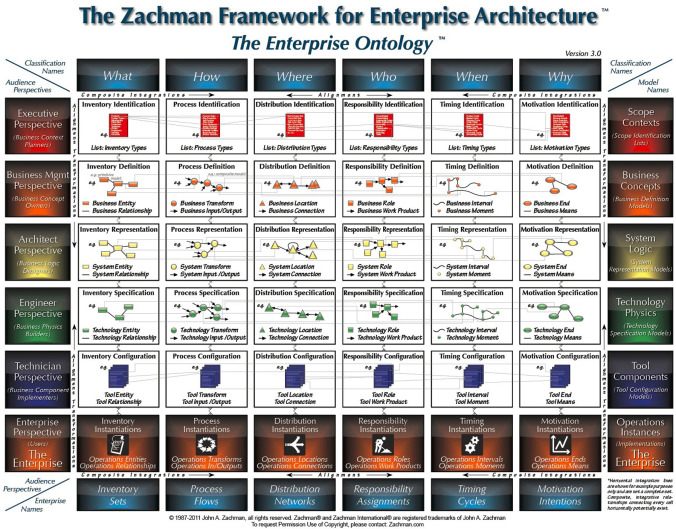
- The Zackman framework for Enterprise Architecture -- which covers six architectural points as well as six primary stakeholders that aid in defining and standardizing IT architecture components.
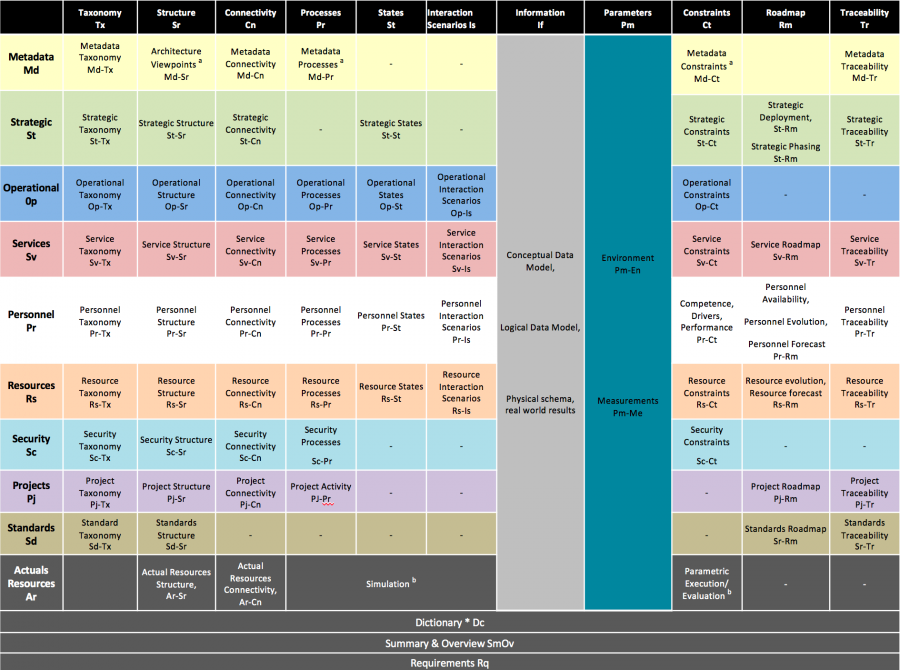
- Unified Architecture Framework (UAF) -- which is a complex but flexible enterprise architecture framework suitable for military and government software development as well as use in commercial businesses. It's implemented as a UML profile.
- Open Agile Architecture -- which focuses an organization around a flexible, extended collection of structures and processes that can grow. It can become an important part of Agile software delivery.
- Federal Enterprise Architecture Framework (FEAF) – which is a reference model that was introduced in 1996 for IT effectiveness. It was designed for the U.S. government but can be used in private companies as well.
Other frameworks include The Open Group Architectural Framework, the European Space Agency Architectural Framework, the SAP Enterprise Architecture Framework or the Ministry of Defence Architecture Framework.
Benefits of enterprise architecture
Possible advantages of having an enterprise architecture include:
- Improved decision-making;
- Improved adaptability to changing demands or market conditions;
- Elimination of inefficient and redundant processes;
- Optimization of the use of organizational assets;
- Minimization of employee turnover;
- Support organization changes for redesigns and reorganization;
- Makes it easier to evaluate architecture against long-term goals;
- Can give views of IT architectures to those outside of IT;
- Can help with the unification of processes in IT;
- Can help simplify finance teams; and
- Facilitates collaboration with project management.
Enterprise architecture vendors, tools and certifications
Several third-party vendors and tools sell enterprise architecture products, as well as some certifications that center around certain skills.
Some example vendors include Orbus Software, Software AG, Planview, Avolution and Sparx Systems.
ServiceNow Project Portfolio Management is an example of one EA tool, used for full visibility. It can keep everyone from different departments on the same page, from Sales to IT. It is relatively easy to configure and allows users to pick the management type -- such as agile -- for each project. However, it may be difficult to use for resource management.
Oracle Enterprise Architecture Framework is another example of an EA tool. The software helps users in developing strategic roadmaps and architectures that enable business and IT alignment. This software is driven by business strategies and simplifies technical architectures; however, it may be difficult to use for beginners.
Some example certifications include:
- Salesforce Certified Technical Architect
- The Open Group Certified Architect
- AWS Certified Solution Architect
- Professional Cloud Solutions Architect Certification
- Certified Information Systems Security Professional-Information Systems Security Architecture Professional
- Made of multiple sub-systems interacting with each other
- Down to atomic entities
- real (physical) things
- conceptual things (ideas or logic)
Do you want to understand your organization?
-> Adopt system thinking
Do you want to frame your system?
-> Create an ontology
Do you want to store, manage and publish representation of your organization
-> Implement a knowledge graph
Knowledge Graphs are tools of choice to describe complex systems. As such they are ideal to describe enterprise (business and IT) architecture
Systems thinking is a way of making sense of the complexity of the world by looking at it in terms of wholes and relationships rather than by splitting it down into its parts.
It has been used as a way of exploring and developing effective action in complex contexts, enabling systems change. Systems thinking draws on and contributes to systems theory and the system sciences.
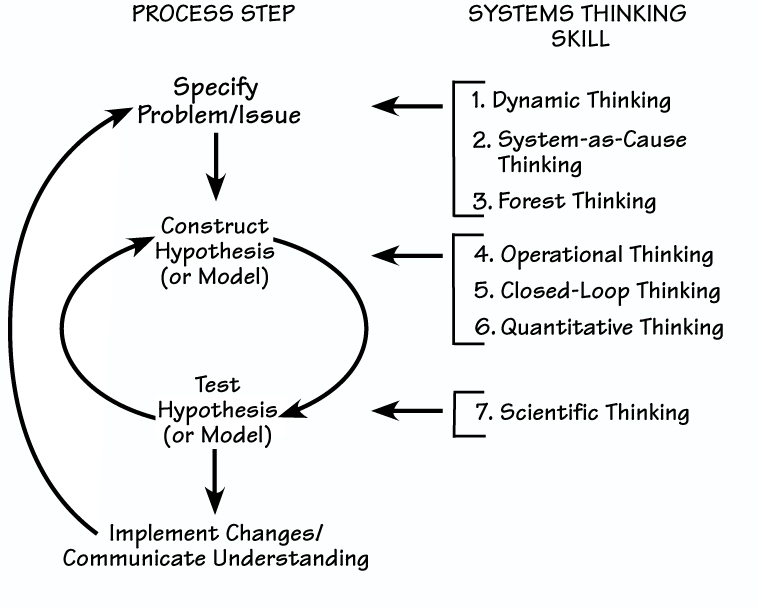
- Dynamic thinking
- System-as-a-cause thinking
- Forest thinking
- Operational thinking
- Closed-loop thinking
- Quantitative thinking
- Scientific thinking
Concrete examples using a knowledge graph to measure business value delivery using an enterprise architecture ontology
15 min
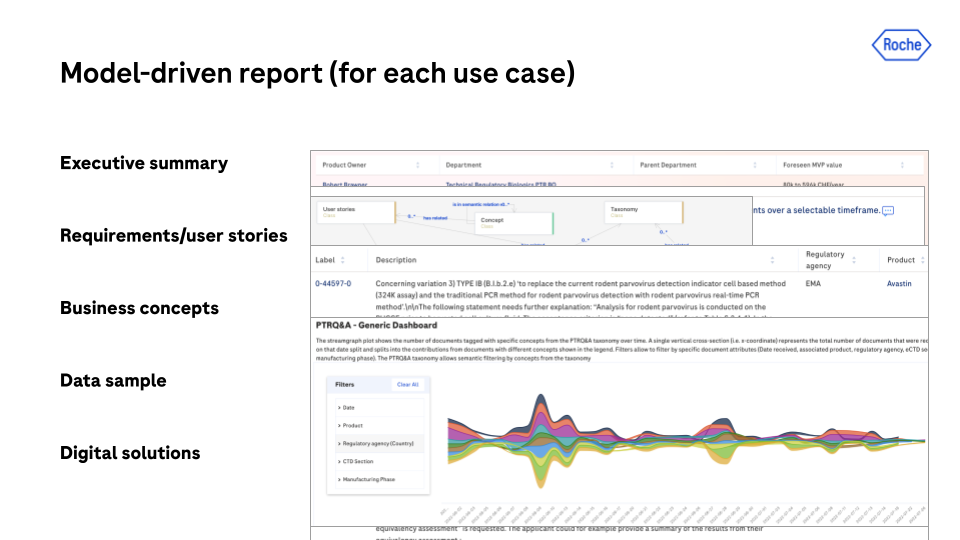
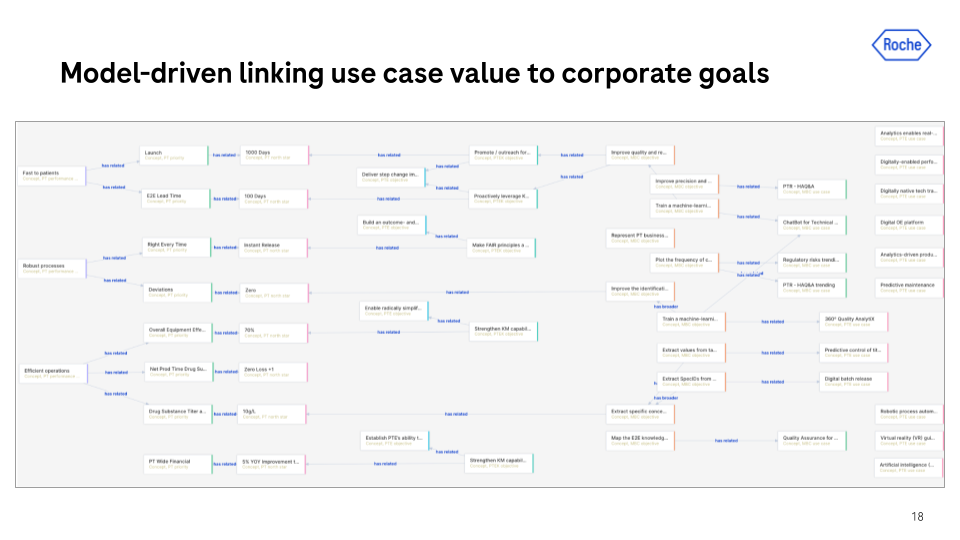
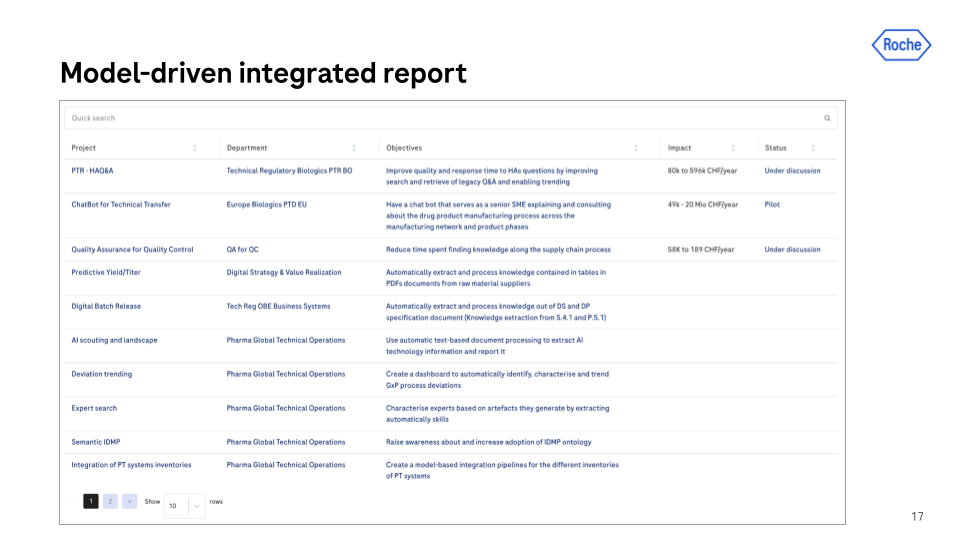
Roche PM Use Case
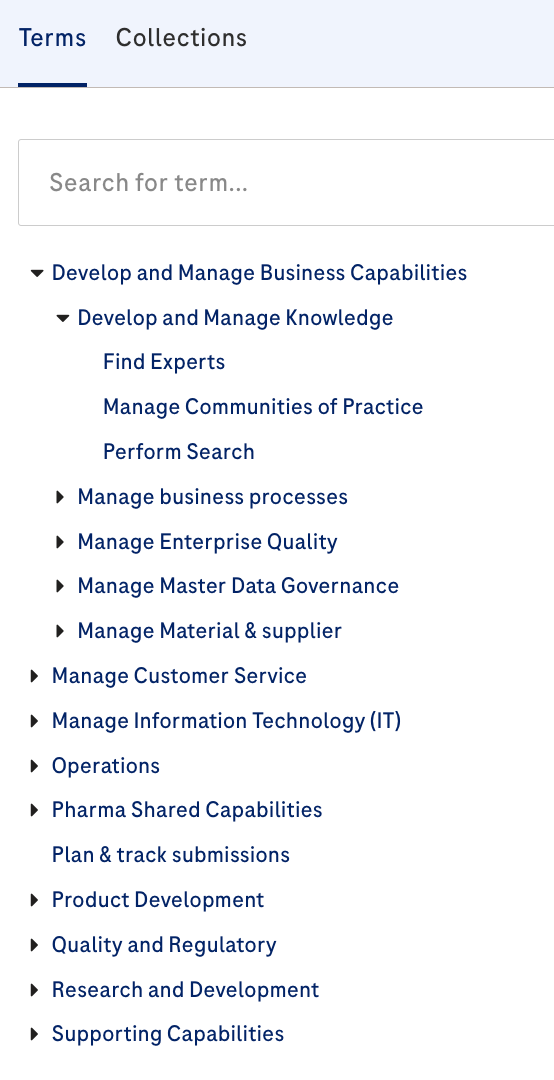
Overarching process
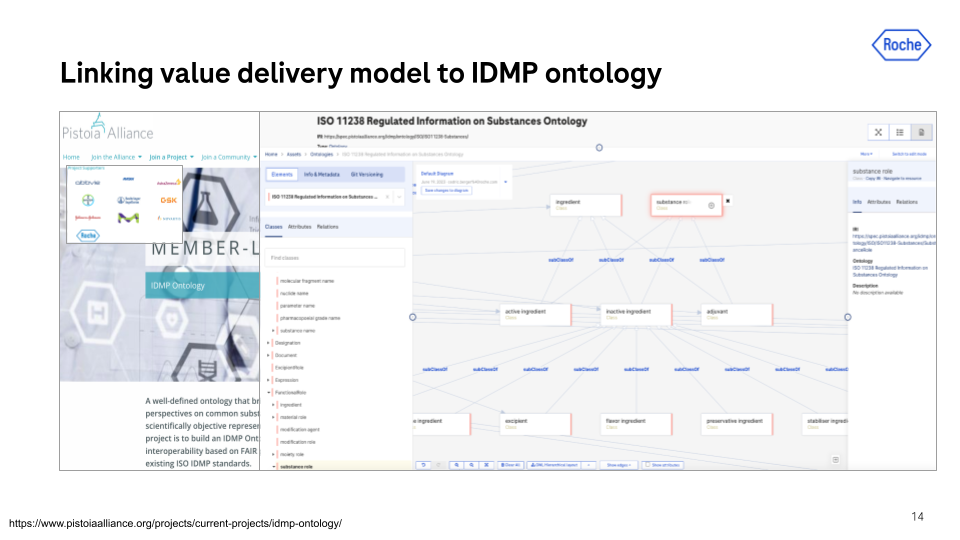
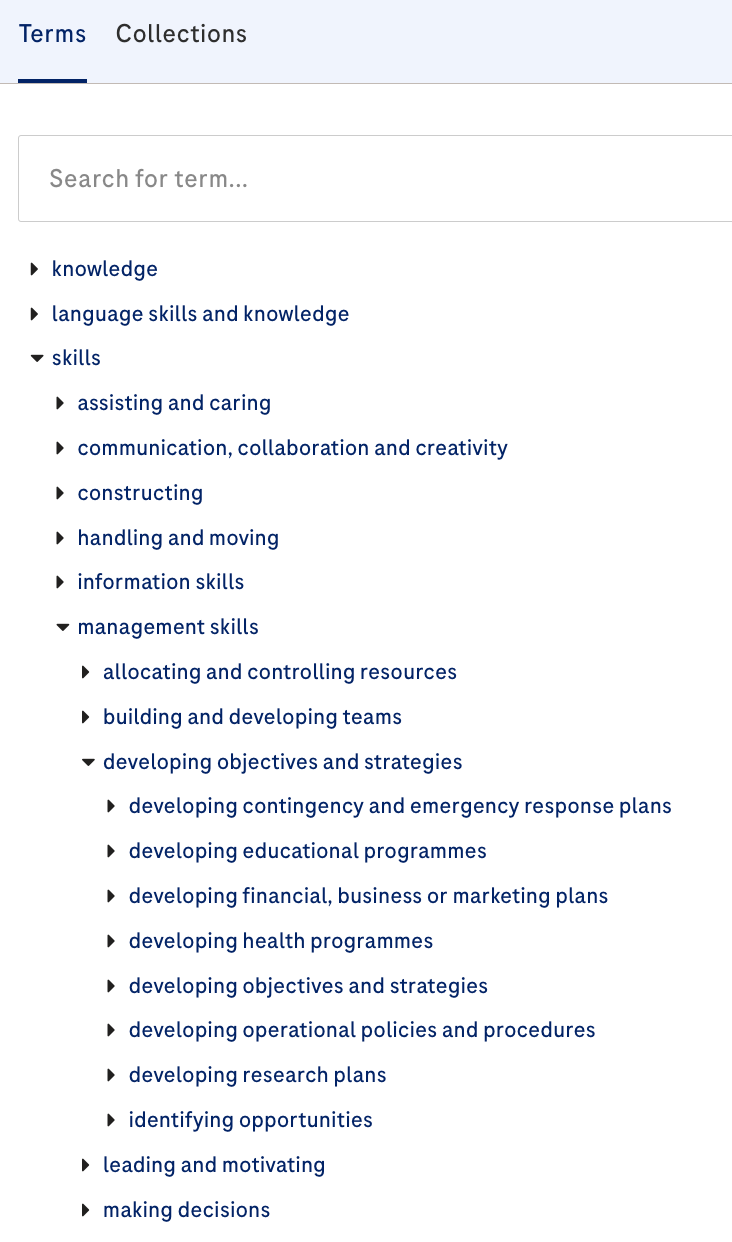
Roche PM Ontology
Project artefacts
Integrated reports
Built on standards